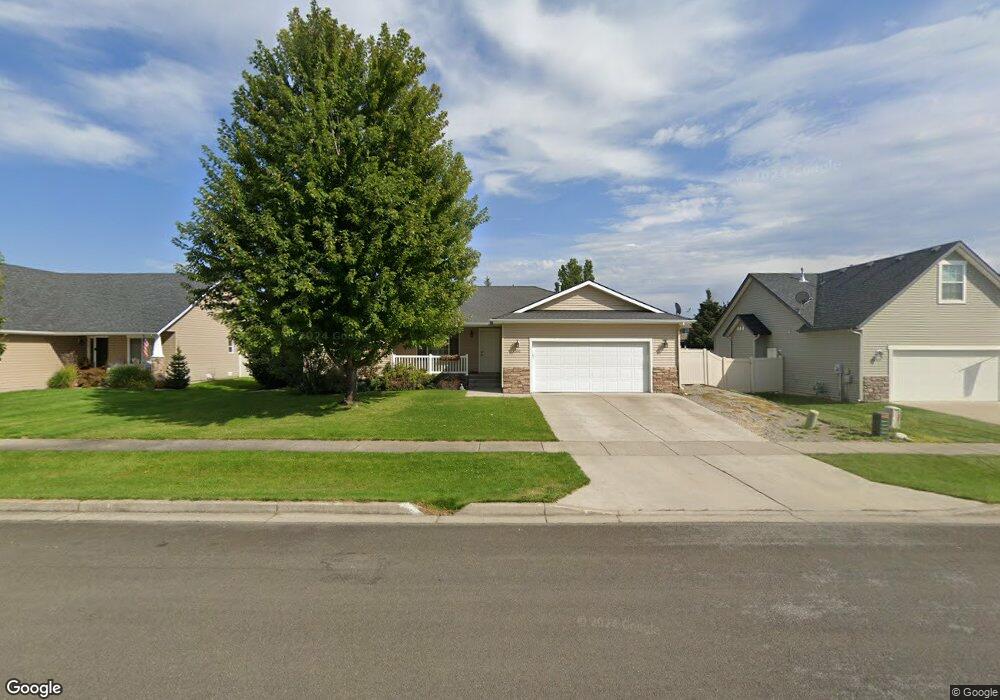
8320 Boysenberry Loop Hayden, ID 83835
Estimated Value: $533,000 - $601,000
5
Beds
3
Baths
2,475
Sq Ft
$228/Sq Ft
Est. Value
About This Home
This home is located at 8320 Boysenberry Loop, Hayden, ID 83835 and is currently estimated at $564,987, approximately $228 per square foot. 8320 Boysenberry Loop is a home located in Kootenai County with nearby schools including Atlas Elementary School, Woodland Middle School, and Lake City High School.
Ownership History
Date
Name
Owned For
Owner Type
Purchase Details
Closed on
Jun 19, 2025
Sold by
Creek Stone Ranch 1 Llc
Bought by
Lanyon Nicholas Andrew and Lanyon Melissa Lynn
Current Estimated Value
Home Financials for this Owner
Home Financials are based on the most recent Mortgage that was taken out on this home.
Original Mortgage
$521,010
Outstanding Balance
$519,672
Interest Rate
6.81%
Mortgage Type
FHA
Estimated Equity
$45,315
Purchase Details
Closed on
Aug 6, 2020
Sold by
Quillin Melvin Bruce and Quillin Geri Lynn
Bought by
Creek Stone Ranch 1 Llc
Purchase Details
Closed on
Jun 5, 2015
Sold by
Moyle Bryan W and Moyle Heather D
Bought by
Quillin Melvin B and Quillin Geri L
Purchase Details
Closed on
Oct 14, 2010
Sold by
Wilhelm Laverl H
Bought by
Fannie Mae and Federal National Mortgage Association
Purchase Details
Closed on
Apr 16, 2008
Sold by
Hallmark Homes Inc
Bought by
Moyle Bryan W and Moyle Heather D
Home Financials for this Owner
Home Financials are based on the most recent Mortgage that was taken out on this home.
Original Mortgage
$213,933
Interest Rate
5.99%
Mortgage Type
New Conventional
Create a Home Valuation Report for This Property
The Home Valuation Report is an in-depth analysis detailing your home's value as well as a comparison with similar homes in the area
Purchase History
| Date | Buyer | Sale Price | Title Company |
|---|---|---|---|
| Lanyon Nicholas Andrew | -- | Flying S Title And Escrow | |
| Creek Stone Ranch 1 Llc | -- | None Available | |
| Quillin Melvin B | -- | Kootenai County Title | |
| Fannie Mae | $249,145 | -- | |
| Moyle Bryan W | -- | -- |
Source: Public Records
Mortgage History
| Date | Status | Borrower | Loan Amount |
|---|---|---|---|
| Open | Lanyon Nicholas Andrew | $521,010 | |
| Previous Owner | Moyle Bryan W | $213,933 |
Source: Public Records
Tax History
| Year | Tax Paid | Tax Assessment Tax Assessment Total Assessment is a certain percentage of the fair market value that is determined by local assessors to be the total taxable value of land and additions on the property. | Land | Improvement |
|---|---|---|---|---|
| 2025 | $2,365 | $504,910 | $190,000 | $314,910 |
| 2024 | $2,249 | $486,530 | $175,000 | $311,530 |
| 2023 | $2,249 | $507,107 | $180,000 | $327,107 |
| 2022 | $2,405 | $561,375 | $200,000 | $361,375 |
| 2021 | $2,418 | $345,715 | $125,000 | $220,715 |
| 2020 | $2,369 | $298,129 | $100,000 | $198,129 |
| 2019 | $2,388 | $276,182 | $96,800 | $179,382 |
| 2018 | $2,360 | $243,810 | $88,000 | $155,810 |
| 2017 | $2,255 | $216,970 | $65,000 | $151,970 |
| 2016 | $2,181 | $201,280 | $57,500 | $143,780 |
| 2015 | $1,141 | $187,880 | $46,000 | $141,880 |
| 2013 | $1,029 | $162,970 | $36,800 | $126,170 |
Source: Public Records
Map
Nearby Homes
- 2547 W Blackberry Loop
- 7948 N Darlena Loop
- 7970 N Darlena Loop
- 7996 N Hibiscus Ln
- 8188 N Ainsworth Dr
- 7767 N Coneflower St
- 2715 W Broadmoore Dr
- 7863 N Mocha Loop
- 7857 N Mocha Loop
- 7853 N Mocha Loop
- 7847 N Mocha Loop
- 7833 N Mocha Loop
- 7827 N Mocha Loop
- 7785 N Mocha Loop
- 7801 N Mocha Loop
- 7767 N Mocha Loop
- 7755 N Mocha Loop
- 7793 N Mocha Loop
- 7773 N Mocha Loop
- 3520 W Cranston Ave
- 8338 N Boysenberry Loop
- 8302 N Boysenberry Loop
- 8788 N Salmonberry Loop
- 8778 Salmonberry
- 8798 N Salmonberry Loop
- 8356 N Boysenberry Loop
- 8760 Salmonberry
- 8319 N Boysenberry Loop
- 8319 Boysenberry Loop
- 8301 N Boysenberry Loop
- 8085 Boysenberry Loop
- 8337 N Boysenberry Loop
- 8742 Salmonberry
- 8114 N Chateaux Dr
- 8374 N Boysenberry Loop
- 8355 N Boysenberry Loop
- 8398 N Raspberry Ln
- 8130 N Chateaux Dr
- 8373 N Boysenberry Loop
- 8765 N Boysenberry Loop
Your Personal Tour Guide
Ask me questions while you tour the home.