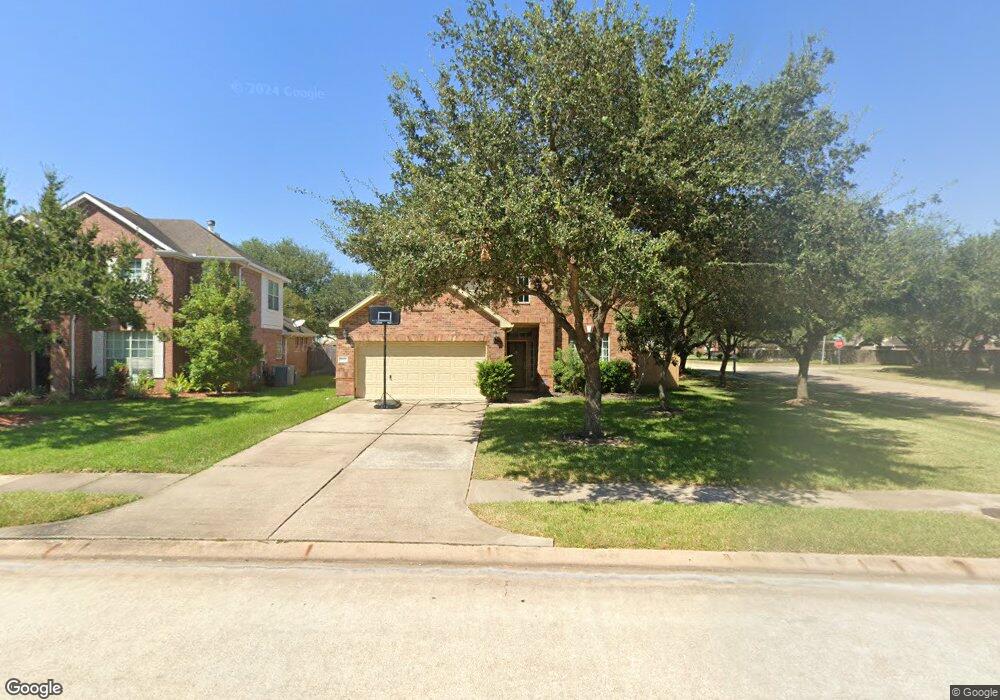
8321 Seagull Ln Pearland, TX 77584
Southwyck NeighborhoodEstimated Value: $393,000 - $429,000
4
Beds
3
Baths
2,949
Sq Ft
$139/Sq Ft
Est. Value
About This Home
This home is located at 8321 Seagull Ln, Pearland, TX 77584 and is currently estimated at $408,472, approximately $138 per square foot. 8321 Seagull Ln is a home located in Brazoria County with nearby schools including Silverlake Elementary School, Rogers Middle School, and Berry Miller Junior High School.
Ownership History
Date
Name
Owned For
Owner Type
Purchase Details
Closed on
Jun 8, 2015
Sold by
Dunn Brendan W
Bought by
Danila Delia and Costa Ionel
Current Estimated Value
Home Financials for this Owner
Home Financials are based on the most recent Mortgage that was taken out on this home.
Original Mortgage
$238,598
Outstanding Balance
$185,261
Interest Rate
3.82%
Mortgage Type
FHA
Estimated Equity
$223,211
Purchase Details
Closed on
Jul 5, 2012
Sold by
Garcia Roberto and Garcia Kimberley
Bought by
Dunn Brendan W
Home Financials for this Owner
Home Financials are based on the most recent Mortgage that was taken out on this home.
Original Mortgage
$200,200
Interest Rate
3.81%
Mortgage Type
VA
Purchase Details
Closed on
Apr 24, 2001
Sold by
Gehan Homes Ltd
Bought by
Garcia Roberto and Garcia Kimberly
Home Financials for this Owner
Home Financials are based on the most recent Mortgage that was taken out on this home.
Original Mortgage
$168,500
Interest Rate
6.81%
Create a Home Valuation Report for This Property
The Home Valuation Report is an in-depth analysis detailing your home's value as well as a comparison with similar homes in the area
Home Values in the Area
Average Home Value in this Area
Purchase History
| Date | Buyer | Sale Price | Title Company |
|---|---|---|---|
| Danila Delia | -- | First American Title | |
| Danila Delia | -- | First American Title | |
| Dunn Brendan W | -- | Startex Title Company | |
| Garcia Roberto | -- | -- |
Source: Public Records
Mortgage History
| Date | Status | Borrower | Loan Amount |
|---|---|---|---|
| Open | Danila Delia | $238,598 | |
| Closed | Danila Delia | $238,598 | |
| Previous Owner | Dunn Brendan W | $200,200 | |
| Previous Owner | Garcia Roberto | $168,500 |
Source: Public Records
Tax History Compared to Growth
Tax History
| Year | Tax Paid | Tax Assessment Tax Assessment Total Assessment is a certain percentage of the fair market value that is determined by local assessors to be the total taxable value of land and additions on the property. | Land | Improvement |
|---|---|---|---|---|
| 2025 | $6,939 | $399,740 | $77,650 | $322,090 |
| 2023 | $6,939 | $351,662 | $77,650 | $317,170 |
| 2022 | $7,690 | $319,693 | $36,980 | $289,760 |
| 2021 | $7,488 | $290,630 | $31,290 | $259,340 |
| 2020 | $7,818 | $290,630 | $31,290 | $259,340 |
| 2019 | $7,109 | $263,420 | $28,450 | $234,970 |
| 2018 | $6,955 | $258,860 | $28,450 | $230,410 |
| 2017 | $7,123 | $263,810 | $28,450 | $235,360 |
| 2016 | $7,069 | $261,810 | $28,450 | $233,360 |
| 2015 | $5,671 | $221,960 | $28,450 | $193,510 |
| 2014 | $5,671 | $203,830 | $28,450 | $175,380 |
Source: Public Records
Map
Nearby Homes
- 3255 Lakeway Ln
- 3326 Lakeway Ln
- 8335 Fite Rd
- 3021 Rocky Point Dr
- 0 Cullen Pkwy Unit 80720255
- 4527 Brookren Ct
- 4622 Pecan Grove Dr
- 2815 Abbey Field Dr
- 4311 Duesenberg Ct
- 18685 Tree Top Ln
- 18660 Tree Top Ln
- 4811 Meadowglen Dr
- 4026 Bentley Dr
- 3911 Clarestone Dr
- 3901 Magnolia Pkwy
- 4915 Pecan Grove Dr
- 00 Cullen Pkwy
- 0000 Cullen Pkwy
- 2826 Foxden Dr
- 4838 Pinder Ln
- 8325 Seagull Ln
- 8329 Seagull Ln
- 8317 Seagull Ln
- 8322 Seagull Ln
- 8318 Seagull Ln
- 8402 Preston Dr
- 8404 Preston Dr
- 8401 Columbus Ct
- 8313 Seagull Ln
- 8314 Seagull Ln
- 8406 Preston Dr
- 8405 Columbus Ct
- 8310 Seagull Ln
- 3239 Pebble Beach Ln
- 8408 Preston Dr
- 8309 Seagull Ln
- 8317 Diamond Way Ct
- 8318 Preston Dr
- 8320 Preston Dr
- 8313 Diamond Way Ct