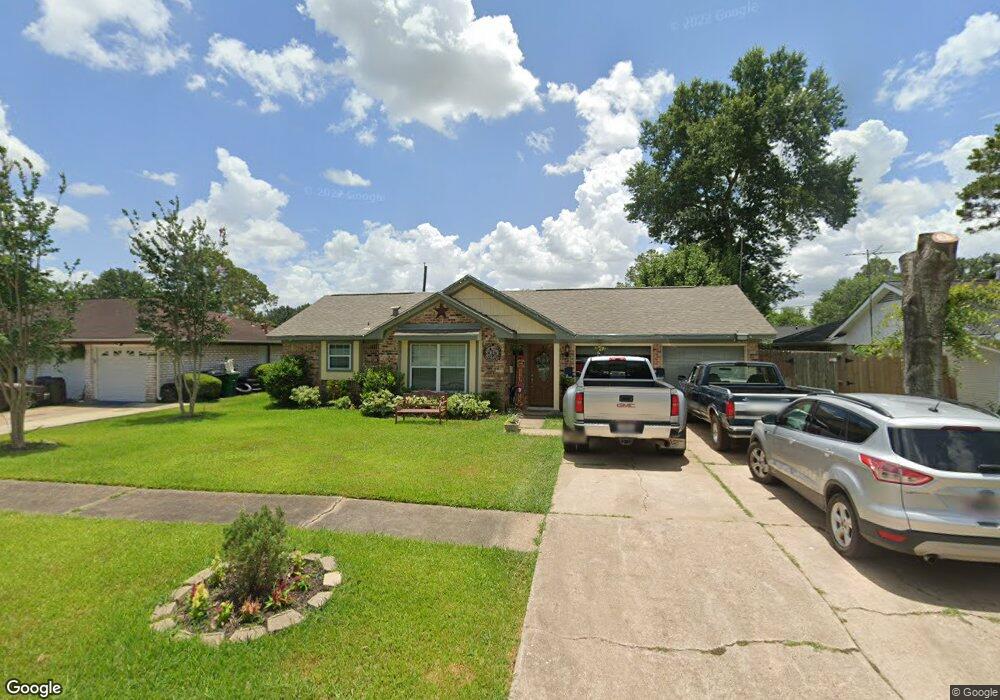
8322 Coastway Ln Houston, TX 77075
Greater Hobby Area NeighborhoodEstimated Value: $241,000 - $278,718
3
Beds
2
Baths
2,054
Sq Ft
$127/Sq Ft
Est. Value
About This Home
This home is located at 8322 Coastway Ln, Houston, TX 77075 and is currently estimated at $259,930, approximately $126 per square foot. 8322 Coastway Ln is a home located in Harris County with nearby schools including Mitchell Elementary School, Albert Thomas Middle School, and Ross Shaw Sterling Aviation High School.
Ownership History
Date
Name
Owned For
Owner Type
Purchase Details
Closed on
Jan 24, 2012
Sold by
Chapman Mary Lou
Bought by
Solache Adan
Current Estimated Value
Home Financials for this Owner
Home Financials are based on the most recent Mortgage that was taken out on this home.
Original Mortgage
$95,000
Interest Rate
4%
Mortgage Type
Purchase Money Mortgage
Purchase Details
Closed on
Feb 10, 2006
Sold by
Archer Dolores
Bought by
Garrett Cherly Archer and Archer Paul Anthony
Purchase Details
Closed on
Oct 25, 2000
Sold by
Woo Armando and Woo Shui Ying Chow
Bought by
Solache Adan and Solache Josefina
Home Financials for this Owner
Home Financials are based on the most recent Mortgage that was taken out on this home.
Original Mortgage
$85,500
Interest Rate
7.89%
Create a Home Valuation Report for This Property
The Home Valuation Report is an in-depth analysis detailing your home's value as well as a comparison with similar homes in the area
Home Values in the Area
Average Home Value in this Area
Purchase History
| Date | Buyer | Sale Price | Title Company |
|---|---|---|---|
| Solache Adan | $895,000 | None Available | |
| Garrett Cherly Archer | -- | Southern American Title | |
| Solache Adan | -- | First American Title |
Source: Public Records
Mortgage History
| Date | Status | Borrower | Loan Amount |
|---|---|---|---|
| Previous Owner | Solache Adan | $95,000 | |
| Previous Owner | Solache Adan | $85,500 | |
| Closed | Solache Adan | $3,500 |
Source: Public Records
Tax History Compared to Growth
Tax History
| Year | Tax Paid | Tax Assessment Tax Assessment Total Assessment is a certain percentage of the fair market value that is determined by local assessors to be the total taxable value of land and additions on the property. | Land | Improvement |
|---|---|---|---|---|
| 2025 | $2,863 | $304,279 | $38,500 | $265,779 |
| 2024 | $2,863 | $277,663 | $37,345 | $240,318 |
| 2023 | $2,863 | $277,663 | $37,345 | $240,318 |
| 2022 | $4,050 | $237,743 | $37,345 | $200,398 |
| 2021 | $3,897 | $212,666 | $26,888 | $185,778 |
| 2020 | $3,681 | $198,917 | $26,334 | $172,583 |
| 2019 | $3,497 | $167,436 | $25,780 | $141,656 |
| 2018 | $1,019 | $64,922 | $27,720 | $37,202 |
| 2017 | $3,031 | $127,401 | $27,720 | $99,681 |
| 2016 | $2,756 | $109,035 | $27,720 | $81,315 |
| 2015 | $1,682 | $105,150 | $27,720 | $77,430 |
| 2014 | $1,682 | $93,274 | $17,325 | $75,949 |
Source: Public Records
Map
Nearby Homes
- 8615 Tartan Walk Ln
- 10806 Tallow Briar
- 8718 Black Cliff Ln
- 8420 Fuqua St
- 11115 Opal Glen Ln
- 8006 Hall Rd
- 8612 Fuqua St
- 001 Fuqua St
- 9130 Garden Breeze Dr
- TBD Arrowhead Ln
- 8405 Folkstone Ln
- 8417 Folkstone Ln
- 7851 Fuqua St
- 10858 Shannon Mills Ln
- 0 Leitz Rd
- 10815 Leitz Rd
- 8412 Peekskill Ln
- 1006 Union Valley Dr
- 3406 Robinson Dr
- 8410 Saylynn Ln
- 8326 Coastway Ln
- 8318 Coastway Ln
- 8327 Lettie St
- 8319 Lettie St
- 8330 Coastway Ln
- 8314 Coastway Ln
- 8323 Coastway Ln
- 8315 Lettie St
- 8331 Lettie St
- 8327 Coastway Ln
- 8319 Coastway Ln
- 8310 Coastway Ln
- 8331 Coastway Ln
- 8315 Coastway Ln
- 8311 Lettie St
- 8311 Coastway Ln
- 8402 Coastway Ln
- 8306 Coastway Ln
- 8322 Gulf Tree Ln
- 0 Lettie St