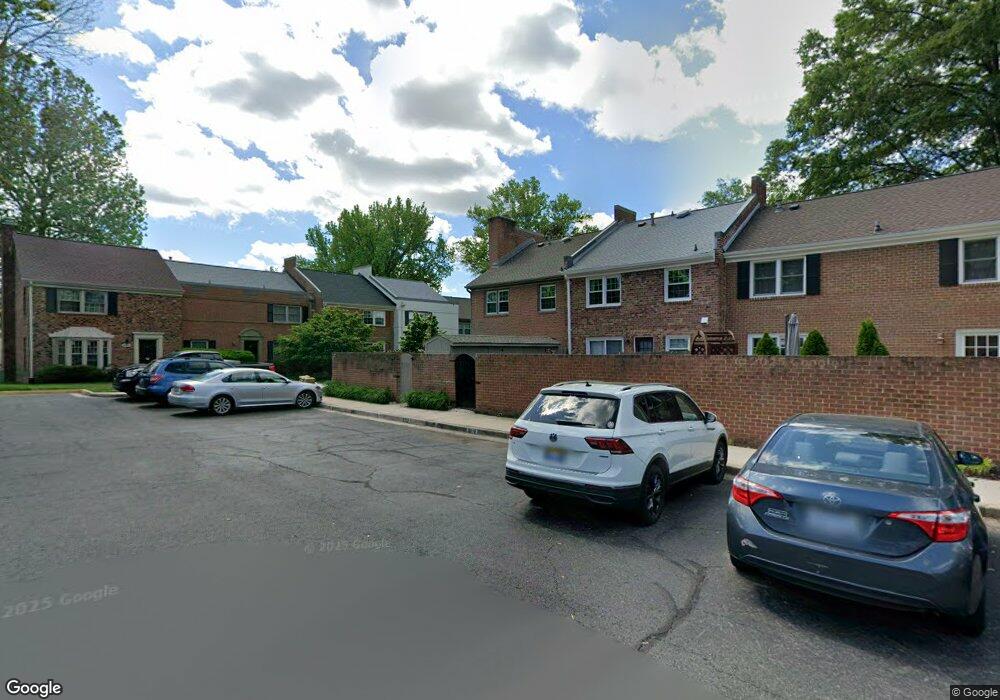
8322 Garfield Ct Springfield, VA 22152
Estimated Value: $563,000 - $637,000
3
Beds
3
Baths
1,540
Sq Ft
$394/Sq Ft
Est. Value
About This Home
This home is located at 8322 Garfield Ct, Springfield, VA 22152 and is currently estimated at $606,685, approximately $393 per square foot. 8322 Garfield Ct is a home located in Fairfax County with nearby schools including Cardinal Forest Elementary School, Irving Middle School, and West Springfield High School.
Ownership History
Date
Name
Owned For
Owner Type
Purchase Details
Closed on
Jan 18, 2024
Sold by
Heal Jonathan L and Heal Karen L
Bought by
Heal Jonathan L and Heal Karen L
Current Estimated Value
Purchase Details
Closed on
Nov 13, 1998
Sold by
Farwell Randall G
Bought by
Heal Jon L
Home Financials for this Owner
Home Financials are based on the most recent Mortgage that was taken out on this home.
Original Mortgage
$127,900
Interest Rate
6.49%
Purchase Details
Closed on
Oct 1, 1993
Sold by
Clayton M A
Bought by
Farwell Randall G
Home Financials for this Owner
Home Financials are based on the most recent Mortgage that was taken out on this home.
Original Mortgage
$143,900
Interest Rate
7%
Create a Home Valuation Report for This Property
The Home Valuation Report is an in-depth analysis detailing your home's value as well as a comparison with similar homes in the area
Home Values in the Area
Average Home Value in this Area
Purchase History
| Date | Buyer | Sale Price | Title Company |
|---|---|---|---|
| Heal Jonathan L | -- | None Listed On Document | |
| Heal Jon L | $159,900 | -- | |
| Farwell Randall G | $159,900 | -- |
Source: Public Records
Mortgage History
| Date | Status | Borrower | Loan Amount |
|---|---|---|---|
| Previous Owner | Heal Jon L | $127,900 | |
| Previous Owner | Farwell Randall G | $143,900 |
Source: Public Records
Tax History
| Year | Tax Paid | Tax Assessment Tax Assessment Total Assessment is a certain percentage of the fair market value that is determined by local assessors to be the total taxable value of land and additions on the property. | Land | Improvement |
|---|---|---|---|---|
| 2025 | $6,820 | $604,050 | $205,000 | $399,050 |
| 2024 | $6,820 | $588,710 | $200,000 | $388,710 |
| 2023 | $6,095 | $540,070 | $185,000 | $355,070 |
| 2022 | $5,845 | $511,150 | $165,000 | $346,150 |
| 2021 | $5,498 | $468,530 | $145,000 | $323,530 |
| 2020 | $5,090 | $430,110 | $130,000 | $300,110 |
| 2019 | $4,966 | $419,580 | $125,000 | $294,580 |
| 2018 | $4,717 | $410,130 | $120,000 | $290,130 |
| 2017 | $4,517 | $389,040 | $110,000 | $279,040 |
| 2016 | $4,597 | $396,810 | $115,000 | $281,810 |
| 2015 | $4,265 | $382,170 | $115,000 | $267,170 |
| 2014 | $4,112 | $369,330 | $105,000 | $264,330 |
Source: Public Records
Map
Nearby Homes
- 5931 Queenston St
- 8333 Garfield Ct
- 8330 Darlington St Unit 467
- 8353D Dunham Ct Unit 642
- 8358D Dunham Ct Unit 622
- 5913 Prince James Dr Unit J
- 8218 Carrleigh Pkwy Unit 10
- 8210 Carrleigh Pkwy Unit 6
- 5818 Torington Dr Unit 859
- 8526 Forrester Blvd Unit 890
- 6003 Sherborn Ln
- 6102 Sherborn Ln
- 5927 Bayshire Rd Unit 115
- 5912 Minutemen Rd Unit 295
- 5925 Minutemen Rd Unit 248
- 8117 Dabney Ave
- 6025 Greeley Blvd
- 6077 Hollow Hill Ln
- 8347 Carrleigh Pkwy
- 8674 Center Rd Unit 1
- 8324 Garfield Ct
- 8326 Garfield Ct
- 8328 Garfield Ct
- 8314 Garfield Ct
- 8318 Garfield Ct
- 8320 Garfield Ct
- 8330 Garfield Ct
- 8312 Garfield Ct
- 8310 Garfield Ct
- 8332 Garfield Ct
- 8319 Forrester Blvd
- 8317 Forrester Blvd
- 8321 Forrester Blvd
- 8315 Forrester Blvd
- 8323 Forrester Blvd
- 8313 Forrester Blvd
- 8334 Garfield Ct
- 8325 Forrester Blvd
- 5942 Seabright Rd
- 8336 Garfield Ct
Your Personal Tour Guide
Ask me questions while you tour the home.