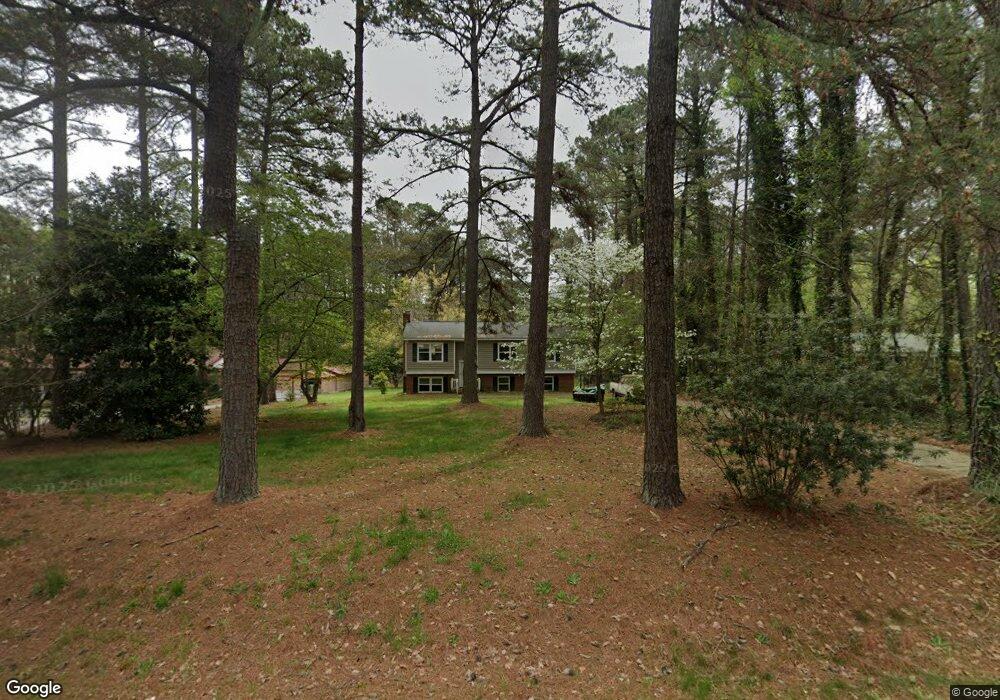
8325 Bells Lake Rd Apex, NC 27539
Middle Creek NeighborhoodEstimated Value: $362,000 - $408,259
3
Beds
2
Baths
1,623
Sq Ft
$241/Sq Ft
Est. Value
About This Home
This home is located at 8325 Bells Lake Rd, Apex, NC 27539 and is currently estimated at $390,565, approximately $240 per square foot. 8325 Bells Lake Rd is a home located in Wake County with nearby schools including West Lake Elementary School, West Lake Middle, and Middle Creek High.
Ownership History
Date
Name
Owned For
Owner Type
Purchase Details
Closed on
Jan 19, 2010
Sold by
Secretary Of Housing & Urban Development
Bought by
Gamble Andrew Paul
Current Estimated Value
Home Financials for this Owner
Home Financials are based on the most recent Mortgage that was taken out on this home.
Original Mortgage
$111,197
Outstanding Balance
$74,111
Interest Rate
5.25%
Mortgage Type
FHA
Estimated Equity
$316,454
Purchase Details
Closed on
Jun 5, 2009
Sold by
Garcia Blass A and Alvarenga Rosa C
Bought by
Secretary Of Housing & Urban Development
Purchase Details
Closed on
Feb 25, 2003
Sold by
Warnick Gordon H and Warnick Mary E
Bought by
Garcia Blass A and Alvarenga Rosa C
Home Financials for this Owner
Home Financials are based on the most recent Mortgage that was taken out on this home.
Original Mortgage
$146,574
Interest Rate
5.93%
Mortgage Type
FHA
Create a Home Valuation Report for This Property
The Home Valuation Report is an in-depth analysis detailing your home's value as well as a comparison with similar homes in the area
Home Values in the Area
Average Home Value in this Area
Purchase History
| Date | Buyer | Sale Price | Title Company |
|---|---|---|---|
| Gamble Andrew Paul | -- | None Available | |
| Secretary Of Housing & Urban Development | $152,643 | None Available | |
| Garcia Blass A | $148,000 | -- |
Source: Public Records
Mortgage History
| Date | Status | Borrower | Loan Amount |
|---|---|---|---|
| Open | Gamble Andrew Paul | $111,197 | |
| Previous Owner | Garcia Blass A | $146,574 |
Source: Public Records
Tax History Compared to Growth
Tax History
| Year | Tax Paid | Tax Assessment Tax Assessment Total Assessment is a certain percentage of the fair market value that is determined by local assessors to be the total taxable value of land and additions on the property. | Land | Improvement |
|---|---|---|---|---|
| 2025 | $1,970 | $304,920 | $135,000 | $169,920 |
| 2024 | $1,914 | $304,920 | $135,000 | $169,920 |
| 2023 | $1,540 | $194,964 | $74,700 | $120,264 |
| 2022 | $1,428 | $194,964 | $74,700 | $120,264 |
| 2021 | $1,390 | $194,964 | $74,700 | $120,264 |
| 2020 | $1,367 | $194,964 | $74,700 | $120,264 |
| 2019 | $1,660 | $200,777 | $97,200 | $103,577 |
| 2018 | $1,527 | $200,777 | $97,200 | $103,577 |
| 2017 | $1,448 | $200,777 | $97,200 | $103,577 |
| 2016 | $1,418 | $200,777 | $97,200 | $103,577 |
| 2015 | $1,344 | $190,635 | $74,000 | $116,635 |
| 2014 | $1,274 | $190,635 | $74,000 | $116,635 |
Source: Public Records
Map
Nearby Homes
- 8224 Bells Lake Rd
- 8220 Bells Lake Rd
- 8405 Bells Lake Rd
- 8201 Rhodes Rd
- 8844 Forester Ln
- 804 Blue Thorn Dr
- 212 Sea Biscuit Ln Unit 25
- 5045 Homeplace Dr
- 3101 Sawyers Mill Dr
- 3909 Langston Cir
- 8008 Deer Meadow Dr
- 8401 Piney Branch Dr
- 333 Calvander Ln
- 120 Corapeake Way
- 124 Corapeake Way
- 128 Corapeake Way
- 104 Corapeake Way
- 3408 Sawyers Mill Dr
- 4317 Glen Arbor Dr
- 8004 Deer Meadow Dr
- 8321 Bells Lake Rd
- 8329 Bells Lake Rd
- 8317 Bells Lake Rd
- 8333 Bells Lake Rd
- 8308 Wanstraw Way
- 8312 Wanstraw Way
- 0 Bells Lake Rd Unit 470218
- 0 Bells Lake Rd Unit 1726999
- 0 Bells Lake Rd Unit 859201
- 0 Bells Lake Rd Unit 7 & 7A TR1726999
- 0 Bells Lake Rd Unit 2150610
- 8116 Bells Lake Rd
- 8024 Bells Lake Rd
- 0 Bells Lake Rd
- 8332 Bells Lake Rd
- 8320 Bells Lake Rd
- 8316 Wanstraw Way
- 8316 Bells Lake Rd
- 4000 Old Sturbridge Dr
- 8313 Bells Lake Rd