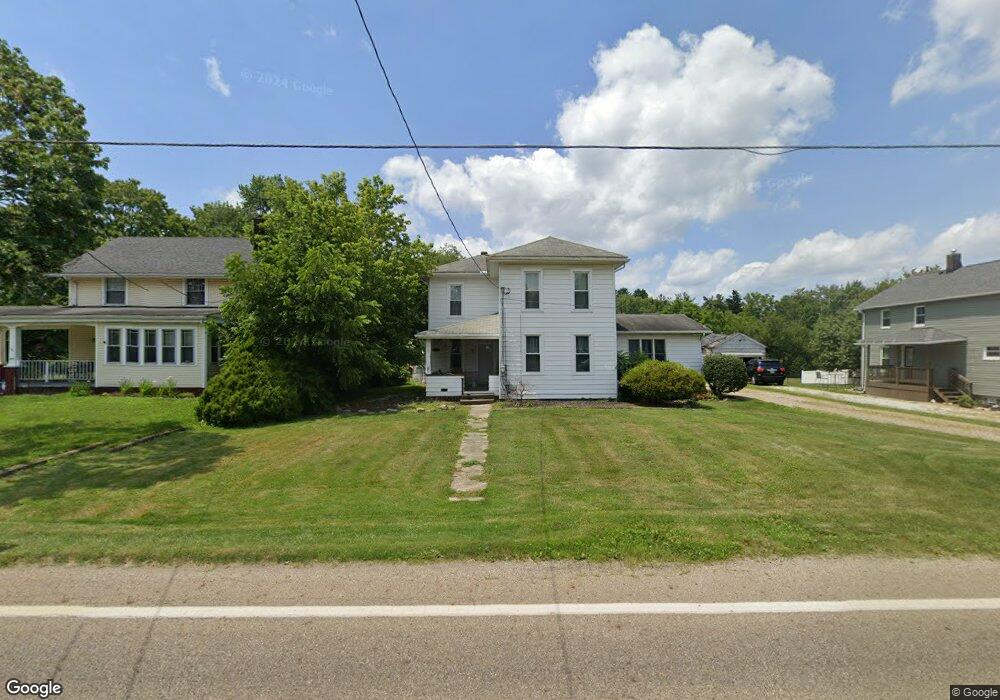
8327 Kent Ave NE Canton, OH 44721
Estimated Value: $206,000 - $284,000
3
Beds
2
Baths
1,905
Sq Ft
$129/Sq Ft
Est. Value
About This Home
This home is located at 8327 Kent Ave NE, Canton, OH 44721 and is currently estimated at $245,527, approximately $128 per square foot. 8327 Kent Ave NE is a home located in Stark County with nearby schools including Lake Middle/High School.
Ownership History
Date
Name
Owned For
Owner Type
Purchase Details
Closed on
Dec 29, 2015
Sold by
Robbins Peter J
Bought by
Dean Dahl Unto M
Current Estimated Value
Purchase Details
Closed on
Aug 20, 2012
Sold by
Cook Jennifer L
Bought by
Robbins Peter J
Purchase Details
Closed on
Aug 3, 2011
Sold by
Domer Claris A
Bought by
Robbins Peter J and Cook Jennifer L
Home Financials for this Owner
Home Financials are based on the most recent Mortgage that was taken out on this home.
Original Mortgage
$112,084
Interest Rate
4.5%
Mortgage Type
FHA
Purchase Details
Closed on
Dec 14, 2007
Sold by
Domer Claris A
Bought by
Sayre John and Sayre Dorothy
Home Financials for this Owner
Home Financials are based on the most recent Mortgage that was taken out on this home.
Original Mortgage
$130,000
Interest Rate
6.31%
Mortgage Type
Seller Take Back
Purchase Details
Closed on
Sep 2, 2005
Sold by
Estate Of Melvin M Domer
Bought by
Domer Claris A
Create a Home Valuation Report for This Property
The Home Valuation Report is an in-depth analysis detailing your home's value as well as a comparison with similar homes in the area
Home Values in the Area
Average Home Value in this Area
Purchase History
| Date | Buyer | Sale Price | Title Company |
|---|---|---|---|
| Dean Dahl Unto M | $108,000 | Attorney | |
| Robbins Peter J | -- | None Available | |
| Robbins Peter J | $115,000 | Attorney | |
| Sayre John | $130,000 | None Available | |
| Domer Claris A | -- | -- |
Source: Public Records
Mortgage History
| Date | Status | Borrower | Loan Amount |
|---|---|---|---|
| Previous Owner | Robbins Peter J | $112,084 | |
| Previous Owner | Sayre John | $130,000 |
Source: Public Records
Tax History Compared to Growth
Tax History
| Year | Tax Paid | Tax Assessment Tax Assessment Total Assessment is a certain percentage of the fair market value that is determined by local assessors to be the total taxable value of land and additions on the property. | Land | Improvement |
|---|---|---|---|---|
| 2025 | -- | $53,590 | $21,390 | $32,200 |
| 2024 | $1,201 | $53,590 | $21,390 | $32,200 |
| 2023 | $2,287 | $45,710 | $12,880 | $32,830 |
| 2022 | $2,185 | $45,710 | $12,880 | $32,830 |
| 2021 | $2,210 | $45,710 | $12,880 | $32,830 |
| 2020 | $2,156 | $39,940 | $11,100 | $28,840 |
| 2019 | $2,138 | $39,950 | $11,100 | $28,850 |
| 2018 | $2,141 | $39,950 | $11,100 | $28,850 |
| 2017 | $1,989 | $34,450 | $11,240 | $23,210 |
| 2016 | $1,994 | $34,480 | $11,270 | $23,210 |
| 2015 | $1,721 | $30,490 | $11,270 | $19,220 |
| 2014 | $1,585 | $29,210 | $10,790 | $18,420 |
| 2013 | $793 | $29,210 | $10,790 | $18,420 |
Source: Public Records
Map
Nearby Homes
- 8994 Kent Ave NE
- 7272 Ashburton Cir NW
- 8275 Rolling Hill Ave NW
- 8271 Pheasant Ave NW
- 7455 Brushmore Ave NW
- 9393 Kent Ave NE
- 2231 Lovers Ln NE
- 2315 Old Elm St NE
- 1216 Marquardt Ave NW
- 8314 Sapphire Ave NE
- 8510 Deacon Ave NW
- 1141 Las Olas Blvd NW
- 2211 Markley St NW
- 9766 Smithdale Ave NE
- Tupelo Plan at Sparwood Farms
- Cedar Plan at Sparwood Farms
- Elder Plan at Sparwood Farms
- Aspen Plan at Sparwood Farms
- 9790 Smithdale Ave NE
- 2315 Rutgers St NW
- 8315 Kent Ave NE
- 8343 Kent Ave NE
- 8349 Kent Ave NE
- 8359 Kent Ave NE
- 8320 Kent Ave NE
- 8340 Kent Ave NE
- 8280 Kent Ave NE
- 8271 Kent Ave NE
- 8399 Kent Ave NE
- 8391 Kent Ave NE
- 8250 Kent Ave NE
- 8425 Kent Ave NE
- 8348 Market Ave N
- 8230 Market Ave N
- 8210 Kent Ave NE
- 1069 Mount Pleasant St NE
- 1209 Mount Pleasant St NE
- 8475 Kent Ave NE
- 1057 Mount Pleasant St NE
- 1231 Mount Pleasant St NE