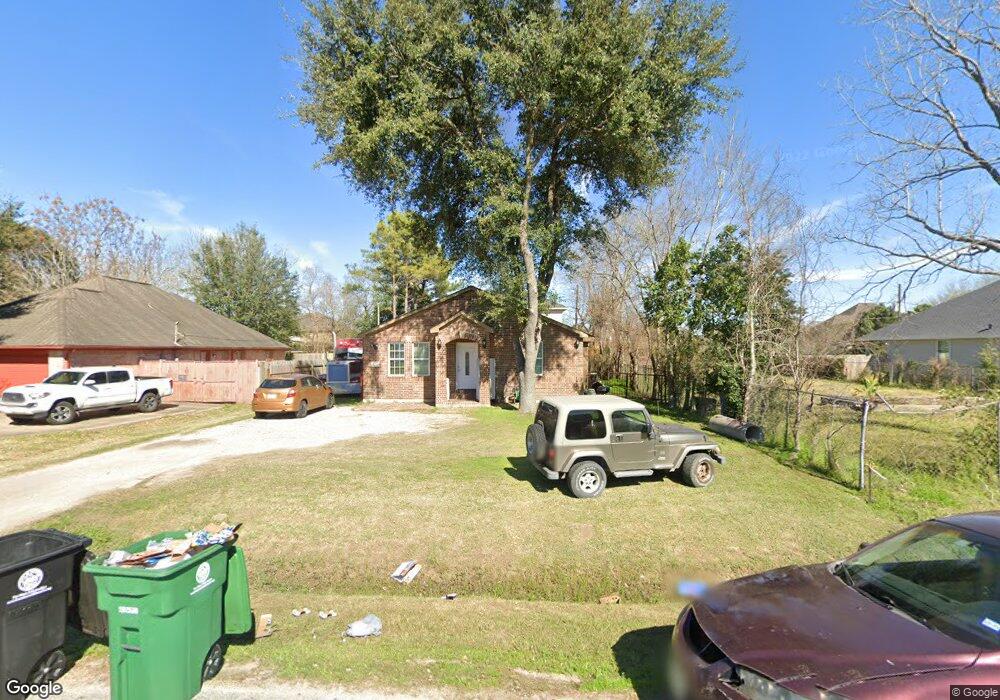
8327 Wayfarer Ln Houston, TX 77075
Greater Hobby Area NeighborhoodEstimated Value: $173,000 - $607,000
2
Beds
1
Bath
1,032
Sq Ft
$426/Sq Ft
Est. Value
About This Home
This home is located at 8327 Wayfarer Ln, Houston, TX 77075 and is currently estimated at $439,357, approximately $425 per square foot. 8327 Wayfarer Ln is a home located in Harris County with nearby schools including James De Anda Elementary, Albert Thomas Middle School, and Ross Shaw Sterling Aviation High School.
Ownership History
Date
Name
Owned For
Owner Type
Purchase Details
Closed on
Sep 24, 2013
Sold by
Deermer Mary Jane
Bought by
Vasquez Nelson A
Current Estimated Value
Purchase Details
Closed on
Jul 31, 2013
Sold by
Robles Ebella
Bought by
Deermer Mary Jane and Broughton Jane M
Purchase Details
Closed on
Sep 15, 2004
Sold by
Deermer Fred R and Deermer Mary Jane
Bought by
Robles Eusebio and Robles Ebelia
Home Financials for this Owner
Home Financials are based on the most recent Mortgage that was taken out on this home.
Original Mortgage
$72,000
Interest Rate
5.95%
Mortgage Type
Seller Take Back
Purchase Details
Closed on
Feb 23, 1998
Sold by
Foster Alstead William and Foster Linda
Bought by
Gil Ramirez Homes Inc
Home Financials for this Owner
Home Financials are based on the most recent Mortgage that was taken out on this home.
Original Mortgage
$100,000
Interest Rate
6.91%
Create a Home Valuation Report for This Property
The Home Valuation Report is an in-depth analysis detailing your home's value as well as a comparison with similar homes in the area
Home Values in the Area
Average Home Value in this Area
Purchase History
| Date | Buyer | Sale Price | Title Company |
|---|---|---|---|
| Vasquez Nelson A | -- | Stewart Title | |
| Deermer Mary Jane | -- | None Available | |
| Robles Eusebio | -- | Texas American Title Company | |
| Gil Ramirez Homes Inc | -- | -- |
Source: Public Records
Mortgage History
| Date | Status | Borrower | Loan Amount |
|---|---|---|---|
| Previous Owner | Robles Eusebio | $72,000 | |
| Previous Owner | Gil Ramirez Homes Inc | $100,000 |
Source: Public Records
Tax History Compared to Growth
Tax History
| Year | Tax Paid | Tax Assessment Tax Assessment Total Assessment is a certain percentage of the fair market value that is determined by local assessors to be the total taxable value of land and additions on the property. | Land | Improvement |
|---|---|---|---|---|
| 2025 | $10,883 | $520,116 | $91,100 | $429,016 |
| 2024 | $10,883 | $520,116 | $91,100 | $429,016 |
| 2023 | $10,883 | $508,039 | $91,100 | $416,939 |
| 2022 | $8,409 | $381,889 | $76,716 | $305,173 |
| 2021 | $6,300 | $270,312 | $64,729 | $205,583 |
| 2020 | $5,720 | $236,198 | $50,345 | $185,853 |
| 2019 | $5,295 | $209,252 | $43,153 | $166,099 |
| 2018 | $3,755 | $148,375 | $34,522 | $113,853 |
| 2017 | $1,841 | $72,792 | $34,522 | $38,270 |
| 2016 | $1,663 | $65,756 | $34,522 | $31,234 |
| 2015 | $1,385 | $60,283 | $28,769 | $31,514 |
| 2014 | $1,385 | $53,864 | $28,769 | $25,095 |
Source: Public Records
Map
Nearby Homes
- 8428 Swiftwater Ln
- 8410 Saylynn Ln
- 8412 Peekskill Ln
- 8405 Folkstone Ln
- 8417 Folkstone Ln
- 8303 Lanham Ln
- 10218 Carmencita Way
- 8614 Viera Ln
- 0 Tavenor Ln Unit 8703277
- 0 Freeland Unit 61398894
- 0 Freeland Unit 70520949
- 8018 Holiday Ln
- TBD Arrowhead Ln
- 0 Wetherby Ln
- 8530 Almeda Genoa Rd
- 8706 Danbury Hollow Ln
- 8420 Fuqua St
- 8612 Fuqua St
- 001 Fuqua St
- 10307 Collin Park
- 8325 Wayfarer Ln
- 8331 Wayfarer Ln
- 8329 Wayfarer Ln
- 8323 Wayfarer Ln
- 8306 Swiftwater Ln
- 8333 Wayfarer Ln
- 8304 Swiftwater Ln
- 8304 Swiftwater Ln
- 8320 Wayfarer Ln
- 8302 Swiftwater Ln
- 8335 Wayfarer Ln
- 8324 Wayfarer Ln
- 8330 Swiftwater Ln
- 8328 Wayfarer Ln
- 10112 Wingtip Dr
- 10106 Wingtip Dr
- 8341 Wayfarer Ln
- 8315 Swiftwater Ln
- 8334 Swiftwater Ln
- 8336 Wayfarer Ln