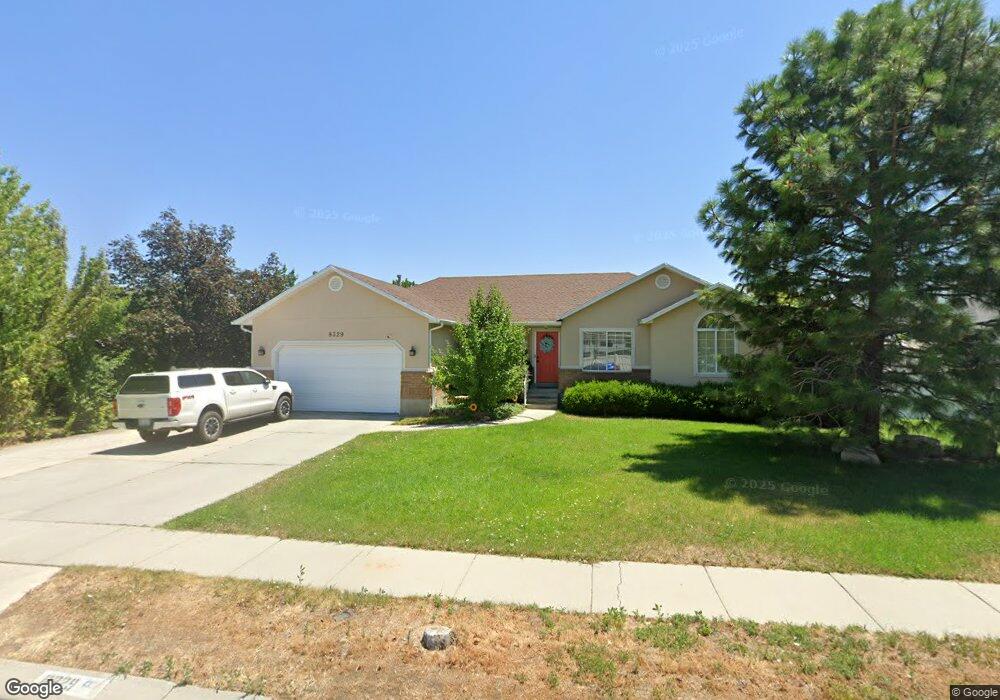
8329 S 5150 W West Jordan, UT 84081
Cobble Creek NeighborhoodEstimated Value: $601,000 - $609,000
3
Beds
2
Baths
3,222
Sq Ft
$188/Sq Ft
Est. Value
About This Home
This home is located at 8329 S 5150 W, West Jordan, UT 84081 and is currently estimated at $605,563, approximately $187 per square foot. 8329 S 5150 W is a home located in Salt Lake County with nearby schools including Hayden Peak Elementary School, West Hills Middle School, and Copper Hills High School.
Ownership History
Date
Name
Owned For
Owner Type
Purchase Details
Closed on
Mar 20, 2009
Sold by
Burnside Corey J and Burnside Johni L
Bought by
Burnside Johni L and Burnside Corey J
Current Estimated Value
Home Financials for this Owner
Home Financials are based on the most recent Mortgage that was taken out on this home.
Original Mortgage
$203,350
Outstanding Balance
$129,440
Interest Rate
5.15%
Mortgage Type
New Conventional
Estimated Equity
$476,123
Purchase Details
Closed on
Oct 3, 1996
Sold by
Holland Marshall C and Holland Karlynn
Bought by
Burnside Corey J and Burnside Johni L
Home Financials for this Owner
Home Financials are based on the most recent Mortgage that was taken out on this home.
Original Mortgage
$140,000
Interest Rate
7.95%
Purchase Details
Closed on
Nov 9, 1995
Sold by
Tr L Homes Inc
Bought by
Holland Marshall C and Holland Karlynn
Home Financials for this Owner
Home Financials are based on the most recent Mortgage that was taken out on this home.
Original Mortgage
$104,000
Interest Rate
7.62%
Create a Home Valuation Report for This Property
The Home Valuation Report is an in-depth analysis detailing your home's value as well as a comparison with similar homes in the area
Home Values in the Area
Average Home Value in this Area
Purchase History
| Date | Buyer | Sale Price | Title Company |
|---|---|---|---|
| Burnside Johni L | -- | First American Title | |
| Burnside Corey J | -- | -- | |
| Holland Marshall C | -- | -- |
Source: Public Records
Mortgage History
| Date | Status | Borrower | Loan Amount |
|---|---|---|---|
| Open | Burnside Johni L | $203,350 | |
| Closed | Burnside Corey J | $140,000 | |
| Previous Owner | Holland Marshall C | $104,000 |
Source: Public Records
Tax History Compared to Growth
Tax History
| Year | Tax Paid | Tax Assessment Tax Assessment Total Assessment is a certain percentage of the fair market value that is determined by local assessors to be the total taxable value of land and additions on the property. | Land | Improvement |
|---|---|---|---|---|
| 2025 | $2,942 | $572,000 | $178,800 | $393,200 |
| 2024 | $2,942 | $566,100 | $177,000 | $389,100 |
| 2023 | $2,942 | $537,300 | $167,000 | $370,300 |
| 2022 | $2,905 | $518,200 | $163,700 | $354,500 |
| 2021 | $2,455 | $398,600 | $127,200 | $271,400 |
| 2020 | $2,278 | $347,200 | $127,200 | $220,000 |
| 2019 | $2,242 | $335,100 | $120,100 | $215,000 |
| 2018 | $2,121 | $314,400 | $120,100 | $194,300 |
| 2017 | $2,010 | $296,700 | $120,100 | $176,600 |
| 2016 | $1,946 | $269,800 | $120,100 | $149,700 |
| 2015 | $1,983 | $268,100 | $126,900 | $141,200 |
| 2014 | $1,828 | $243,300 | $116,700 | $126,600 |
Source: Public Records
Map
Nearby Homes
- 8322 Copper Vista Cir
- 8453 S Windmill Dr
- 8577 Autumn Gold Cir
- 7903 Mckenzie Ln
- 5422 W Island Creek Dr
- 5298 W Icehouse Way
- 5228 W Ranches Loop Rd
- 5189 W Dove Creek Ln
- 4887 W 8620 S
- 7908 Cold Stone Ln Unit N3
- 7882 S Dove Creek Ln Unit A6
- 5262 W Cool Water Way
- 7877 S 5440 W Unit 119
- 8359 Etude Dr
- 8854 Rocky Creek Dr
- 4678 Emmons Dr
- 8767 S Brown Park Dr
- 5719 W Boulder Creek Rd
- 5746 W Swift Creek Rd
- 7973 S Nebo Dr
- 8313 S 5150 W
- 5138 Cobble Creek Dr
- 5122 Cobble Creek Dr
- 5122 Cobble Creek Dr Unit 509
- 8314 Cobble Creek Dr
- 5163 W 8320 S
- 8299 S 5150 W
- 8304 S 5150 W
- 5164 W 8320 S
- 8298 Cobble Creek Dr
- 8298 S Cobble Creek Dr Unit 511
- 8298 S Cobble Creek Dr
- 5166 W Cobble Cir
- 5166 Cobble Cir
- 5121 W Cobble Creek Dr Unit 508
- 5121 W Cobble Creek Dr
- 5121 Cobble Creek Dr
- 5175 W 8320 S
- 5131 Cobble Creek Dr
- 8281 S 5150 W