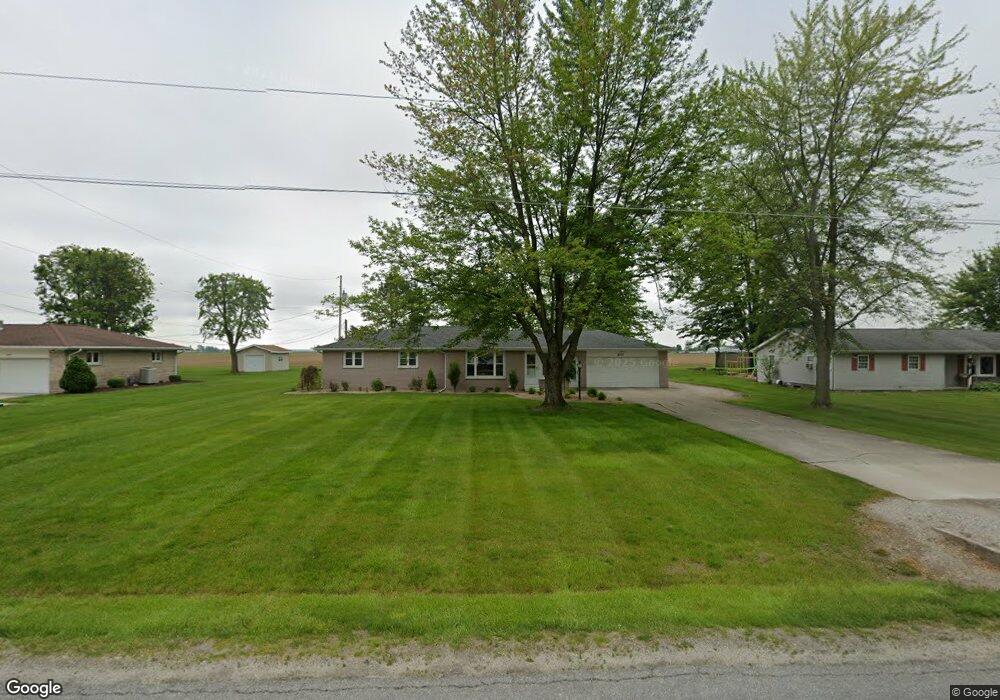
833 E Wayne St Paulding, OH 45879
Estimated Value: $151,727 - $215,000
3
Beds
1
Bath
1,448
Sq Ft
$121/Sq Ft
Est. Value
About This Home
This home is located at 833 E Wayne St, Paulding, OH 45879 and is currently estimated at $174,682, approximately $120 per square foot. 833 E Wayne St is a home located in Paulding County with nearby schools including Paulding High School.
Ownership History
Date
Name
Owned For
Owner Type
Purchase Details
Closed on
Apr 1, 2013
Sold by
Manz Frederucj E and Manz Kayla J
Bought by
Lamb Anna M
Current Estimated Value
Home Financials for this Owner
Home Financials are based on the most recent Mortgage that was taken out on this home.
Original Mortgage
$84,183
Outstanding Balance
$58,364
Interest Rate
3.46%
Mortgage Type
New Conventional
Estimated Equity
$116,318
Purchase Details
Closed on
Jun 9, 2009
Sold by
Franklin Samuel Edward
Bought by
Manz Frederick E and Manz Kayla J
Home Financials for this Owner
Home Financials are based on the most recent Mortgage that was taken out on this home.
Original Mortgage
$56,700
Interest Rate
4.92%
Mortgage Type
New Conventional
Purchase Details
Closed on
Nov 23, 2004
Sold by
Franklin Samuel Earl
Bought by
Lamb Anna M
Purchase Details
Closed on
Sep 8, 2004
Sold by
Franklin Sam
Bought by
Lamb Anna M
Create a Home Valuation Report for This Property
The Home Valuation Report is an in-depth analysis detailing your home's value as well as a comparison with similar homes in the area
Home Values in the Area
Average Home Value in this Area
Purchase History
| Date | Buyer | Sale Price | Title Company |
|---|---|---|---|
| Lamb Anna M | $85,000 | None Available | |
| Manz Frederick E | $72,000 | None Available | |
| Lamb Anna M | -- | -- | |
| Lamb Anna M | -- | -- |
Source: Public Records
Mortgage History
| Date | Status | Borrower | Loan Amount |
|---|---|---|---|
| Open | Lamb Anna M | $84,183 | |
| Previous Owner | Manz Frederick E | $56,700 |
Source: Public Records
Tax History
| Year | Tax Paid | Tax Assessment Tax Assessment Total Assessment is a certain percentage of the fair market value that is determined by local assessors to be the total taxable value of land and additions on the property. | Land | Improvement |
|---|---|---|---|---|
| 2025 | $1,990 | $45,990 | $7,910 | $38,080 |
| 2024 | $1,990 | $38,330 | $6,580 | $31,750 |
| 2023 | $1,723 | $38,330 | $6,580 | $31,750 |
| 2022 | $1,670 | $38,330 | $6,580 | $31,750 |
| 2021 | $1,515 | $30,870 | $6,580 | $24,290 |
| 2020 | $1,355 | $30,870 | $6,580 | $24,290 |
| 2019 | $1,367 | $29,720 | $6,580 | $23,140 |
| 2018 | $1,340 | $29,720 | $6,580 | $23,140 |
| 2017 | $1,341 | $29,720 | $6,580 | $23,140 |
| 2016 | $1,341 | $29,720 | $6,580 | $23,140 |
| 2015 | $1,417 | $31,890 | $5,880 | $26,010 |
| 2014 | $1,410 | $31,890 | $5,880 | $26,010 |
| 2013 | $1,525 | $31,890 | $5,880 | $26,010 |
Source: Public Records
Map
Nearby Homes
Your Personal Tour Guide
Ask me questions while you tour the home.