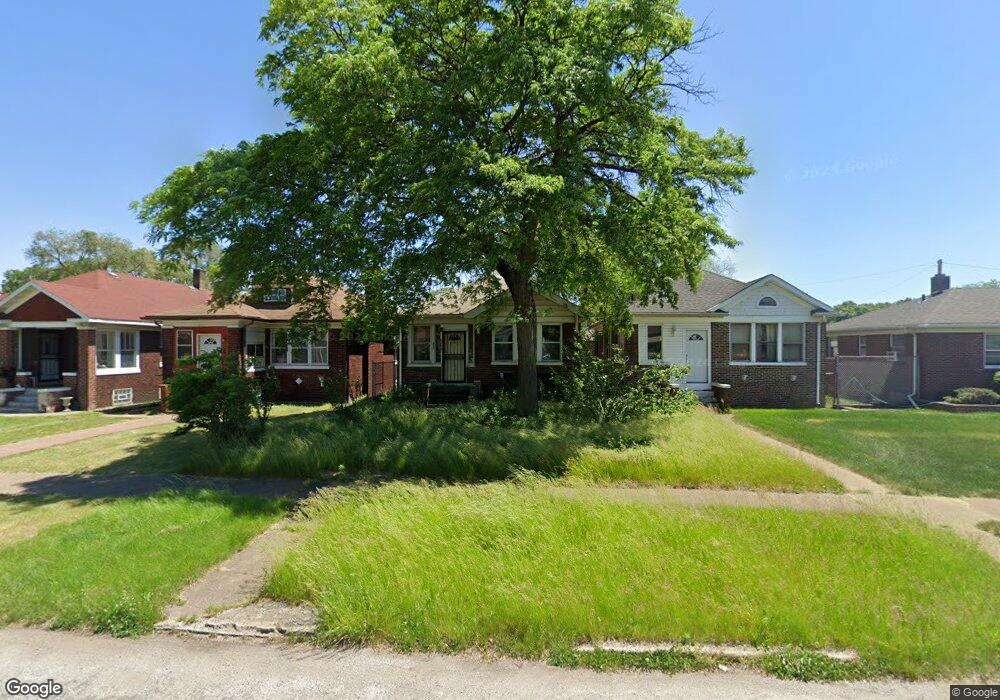
833 Fillmore St Gary, IN 46402
Downtown Gary NeighborhoodEstimated Value: $66,000 - $89,000
2
Beds
1
Bath
976
Sq Ft
$82/Sq Ft
Est. Value
About This Home
This home is located at 833 Fillmore St, Gary, IN 46402 and is currently estimated at $79,634, approximately $81 per square foot. 833 Fillmore St is a home located in Lake County with nearby schools including Beveridge Elementary School, Gary Middle School, and West Side Leadership Academy.
Ownership History
Date
Name
Owned For
Owner Type
Purchase Details
Closed on
Oct 29, 2025
Sold by
Mccarey Melinda J
Bought by
Melinda J Mccarey Revocable Living Trust
Current Estimated Value
Purchase Details
Closed on
May 12, 2016
Sold by
Fannie Mae
Bought by
Mccarey Melinda
Purchase Details
Closed on
Oct 2, 2015
Sold by
Richardson Vera M
Bought by
Federal National Mortgage Association
Purchase Details
Closed on
Oct 19, 2007
Sold by
Harmon Doris
Bought by
Richardson Vera
Purchase Details
Closed on
Sep 7, 2006
Sold by
Harmon Regina
Bought by
Richardson Vera M and Harmon Doris
Create a Home Valuation Report for This Property
The Home Valuation Report is an in-depth analysis detailing your home's value as well as a comparison with similar homes in the area
Home Values in the Area
Average Home Value in this Area
Purchase History
| Date | Buyer | Sale Price | Title Company |
|---|---|---|---|
| Melinda J Mccarey Revocable Living Trust | -- | None Listed On Document | |
| Mccarey Melinda | $6,200 | Fidelity National Title Comp | |
| Federal National Mortgage Association | $9,200 | Attorney | |
| Richardson Vera | -- | None Available | |
| Richardson Vera M | -- | None Available |
Source: Public Records
Tax History
| Year | Tax Paid | Tax Assessment Tax Assessment Total Assessment is a certain percentage of the fair market value that is determined by local assessors to be the total taxable value of land and additions on the property. | Land | Improvement |
|---|---|---|---|---|
| 2025 | $1,648 | $65,700 | $5,300 | $60,400 |
| 2024 | $5,176 | $59,900 | $5,300 | $54,600 |
| 2023 | $1,530 | $58,700 | $4,700 | $54,000 |
| 2022 | $1,530 | $59,700 | $3,000 | $56,700 |
| 2021 | $1,414 | $55,200 | $3,000 | $52,200 |
| 2020 | $1,401 | $54,700 | $3,000 | $51,700 |
| 2019 | $1,255 | $54,200 | $3,000 | $51,200 |
| 2018 | $1,253 | $51,000 | $2,800 | $48,200 |
| 2017 | $1,175 | $51,600 | $2,800 | $48,800 |
| 2016 | $1,209 | $53,900 | $2,800 | $51,100 |
| 2014 | -- | $37,900 | $3,500 | $34,400 |
| 2013 | -- | $37,200 | $3,500 | $33,700 |
Source: Public Records
Map
Nearby Homes
- 833 Tyler St
- 749 Buchanan St
- 743 Buchanan St
- 733 Lincoln St
- 851 Johnson St
- 755 Johnson St
- 1109 W 11th Ave
- 1141 Fillmore St
- 1168 Fillmore St
- 537 Harrison St
- 1123 - 1125 Van Buren St
- 1165 Harrison St
- 1148 Jackson St
- 565 Jackson St
- 1695 W 10th Ave
- 1005 Garfield St
- 435 Buchanan St Unit 46402
- 1665 W 12th Ave
- 408 Pierce St
- 1356 Johnson St
Your Personal Tour Guide
Ask me questions while you tour the home.