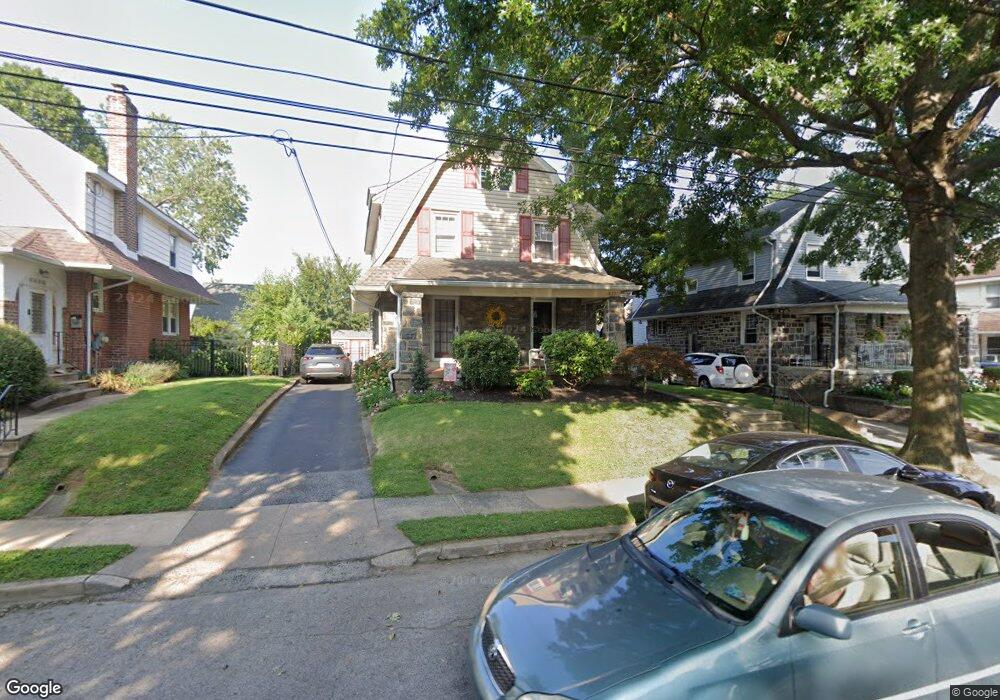
833 Foss Ave Drexel Hill, PA 19026
Estimated Value: $387,000 - $426,000
4
Beds
2
Baths
1,856
Sq Ft
$215/Sq Ft
Est. Value
About This Home
This home is located at 833 Foss Ave, Drexel Hill, PA 19026 and is currently estimated at $398,379, approximately $214 per square foot. 833 Foss Ave is a home located in Delaware County with nearby schools including Hillcrest El School, Drexel Hill Middle School, and Upper Darby High School.
Ownership History
Date
Name
Owned For
Owner Type
Purchase Details
Closed on
Feb 27, 1998
Sold by
Dickson Steven and Dickson Denise
Bought by
Armstrong Michael P and Armstrong Karen A
Current Estimated Value
Home Financials for this Owner
Home Financials are based on the most recent Mortgage that was taken out on this home.
Original Mortgage
$136,861
Outstanding Balance
$24,838
Interest Rate
6.93%
Mortgage Type
FHA
Estimated Equity
$373,541
Purchase Details
Closed on
Dec 20, 1994
Sold by
Walton John J and Walton Joanne M
Bought by
Dickson Steven and Dickson Denise
Home Financials for this Owner
Home Financials are based on the most recent Mortgage that was taken out on this home.
Original Mortgage
$120,000
Interest Rate
9.2%
Create a Home Valuation Report for This Property
The Home Valuation Report is an in-depth analysis detailing your home's value as well as a comparison with similar homes in the area
Home Values in the Area
Average Home Value in this Area
Purchase History
| Date | Buyer | Sale Price | Title Company |
|---|---|---|---|
| Armstrong Michael P | $140,000 | -- | |
| Dickson Steven | $134,000 | Commonwealth Land Title Ins |
Source: Public Records
Mortgage History
| Date | Status | Borrower | Loan Amount |
|---|---|---|---|
| Open | Armstrong Michael P | $136,861 | |
| Previous Owner | Dickson Steven | $120,000 |
Source: Public Records
Tax History Compared to Growth
Tax History
| Year | Tax Paid | Tax Assessment Tax Assessment Total Assessment is a certain percentage of the fair market value that is determined by local assessors to be the total taxable value of land and additions on the property. | Land | Improvement |
|---|---|---|---|---|
| 2025 | $7,399 | $174,950 | $54,720 | $120,230 |
| 2024 | $7,399 | $174,950 | $54,720 | $120,230 |
| 2023 | $7,329 | $174,950 | $54,720 | $120,230 |
| 2022 | $7,132 | $174,950 | $54,720 | $120,230 |
| 2021 | $9,617 | $174,950 | $54,720 | $120,230 |
| 2020 | $8,793 | $135,930 | $51,100 | $84,830 |
| 2019 | $8,638 | $135,930 | $51,100 | $84,830 |
| 2018 | $8,539 | $135,930 | $0 | $0 |
| 2017 | $8,317 | $135,930 | $0 | $0 |
| 2016 | $746 | $135,930 | $0 | $0 |
| 2015 | $746 | $135,930 | $0 | $0 |
| 2014 | $746 | $135,930 | $0 | $0 |
Source: Public Records
Map
Nearby Homes
- 828 Mason Ave
- 844 Mason Ave
- 904 Harper Ave
- 912 Edmonds Ave
- 930 Ormond Ave
- 729 Edmonds Ave
- 719 Mason Ave
- 734 Concord Ave
- 831 Lindale Ave
- 718 Concord Ave
- 1025 Shadeland Ave
- 909 Kenwood Rd
- 1037 Cobbs St
- 910 Fariston Dr
- 1048 Morgan Ave
- 1200 Ormond Ave
- 833 Wilde Ave
- 827 Hampshire Rd
- 1113 Drexel Ave
- 2548 Irvington Rd