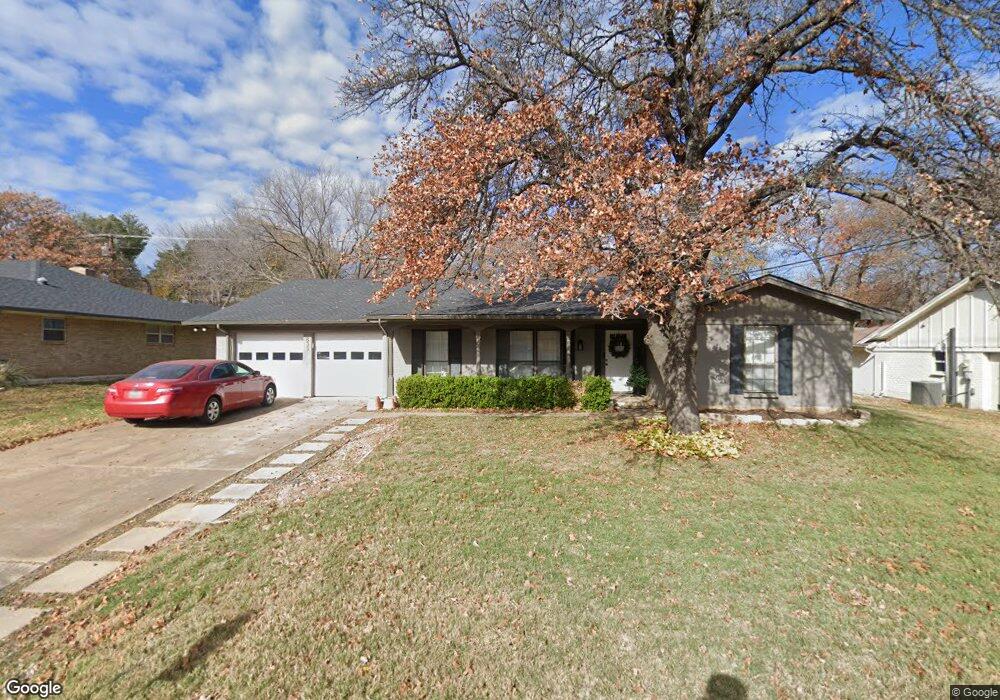
833 Harwood Terrace Bedford, TX 76021
Estimated Value: $393,153 - $469,000
4
Beds
3
Baths
2,473
Sq Ft
$174/Sq Ft
Est. Value
About This Home
This home is located at 833 Harwood Terrace, Bedford, TX 76021 and is currently estimated at $430,538, approximately $174 per square foot. 833 Harwood Terrace is a home located in Tarrant County with nearby schools including Bedford Heights Elementary School, Bedford Junior High School, and L.D. Bell High School.
Ownership History
Date
Name
Owned For
Owner Type
Purchase Details
Closed on
Apr 11, 2013
Sold by
Gambrell Millie and Feldman Roger
Bought by
Siegrist Dustin D and Siegrist Rebecca A
Current Estimated Value
Home Financials for this Owner
Home Financials are based on the most recent Mortgage that was taken out on this home.
Original Mortgage
$72,000
Outstanding Balance
$51,029
Interest Rate
3.56%
Mortgage Type
New Conventional
Estimated Equity
$379,509
Purchase Details
Closed on
Aug 27, 2003
Sold by
Gambrell Jessica Aline
Bought by
Gambrell Millie and Gambrell Jessica Aline
Purchase Details
Closed on
Jun 16, 1998
Sold by
Gambrell Mildred F
Bought by
Gambrell Vernon David
Create a Home Valuation Report for This Property
The Home Valuation Report is an in-depth analysis detailing your home's value as well as a comparison with similar homes in the area
Home Values in the Area
Average Home Value in this Area
Purchase History
| Date | Buyer | Sale Price | Title Company |
|---|---|---|---|
| Siegrist Dustin D | -- | None Available | |
| Gambrell Millie | -- | Allegiance Title Co | |
| Gambrell Vernon David | -- | -- |
Source: Public Records
Mortgage History
| Date | Status | Borrower | Loan Amount |
|---|---|---|---|
| Open | Siegrist Dustin D | $72,000 | |
| Closed | Gambrell Vernon David | $0 |
Source: Public Records
Tax History Compared to Growth
Tax History
| Year | Tax Paid | Tax Assessment Tax Assessment Total Assessment is a certain percentage of the fair market value that is determined by local assessors to be the total taxable value of land and additions on the property. | Land | Improvement |
|---|---|---|---|---|
| 2025 | $4,679 | $306,399 | $65,000 | $241,399 |
| 2024 | $4,679 | $306,399 | $65,000 | $241,399 |
| 2023 | $5,309 | $276,776 | $45,000 | $231,776 |
| 2022 | $5,702 | $261,064 | $45,000 | $216,064 |
| 2021 | $5,444 | $231,128 | $45,000 | $186,128 |
| 2020 | $6,021 | $253,236 | $45,000 | $208,236 |
| 2019 | $6,764 | $278,419 | $45,000 | $233,419 |
| 2018 | $6,206 | $255,470 | $45,000 | $210,470 |
| 2017 | $5,537 | $228,901 | $30,000 | $198,901 |
| 2016 | $5,100 | $210,823 | $30,000 | $180,823 |
| 2015 | $4,445 | $177,000 | $20,000 | $157,000 |
| 2014 | $4,445 | $177,000 | $20,000 | $157,000 |
Source: Public Records
Map
Nearby Homes
- 909 Brestol Ct W
- 3624 Wayne Ct
- 3609 Wayne Ct
- 3605 Spring Valley Dr
- 628 Huntwich Dr
- 1109 Simpson Terrace
- 1136 Wingate Dr
- 913 Kensington Ct
- 4002 Copperwood Ct
- 3907 Copperwood Ct
- 3213 Spring Valley Dr
- 1209 Hillandale Ct
- 3301 Wendover Ct
- 405 Woodbriar Ct
- 4105 Inwood Ln
- 3119 Spring Grove Dr
- 1303 Crest Dr
- 305 Warbler Dr
- 801 Shady Creek Ln
- 320 Blue Quail Ct
- 829 Harwood Terrace
- 909 Harwood Terrace
- 900 Brestol Ct W
- 3640 Spring Grove Dr
- 904 Brestol Ct W
- 825 Harwood Terrace
- 913 Harwood Terrace
- 820 Morning Glory Ln
- 3645 Shady Brook Dr
- 908 Brestol Ct W
- 816 Morning Glory Ln
- 3704 Wisteria Ln
- 3636 Spring Grove Dr
- 3641 Spring Grove Dr
- 917 Harwood Terrace
- 901 Brestol Ct W
- 3641 Shady Brook Dr
- 912 Brestol Ct W
- 3637 Spring Grove Dr
- 808 Morning Glory Ln