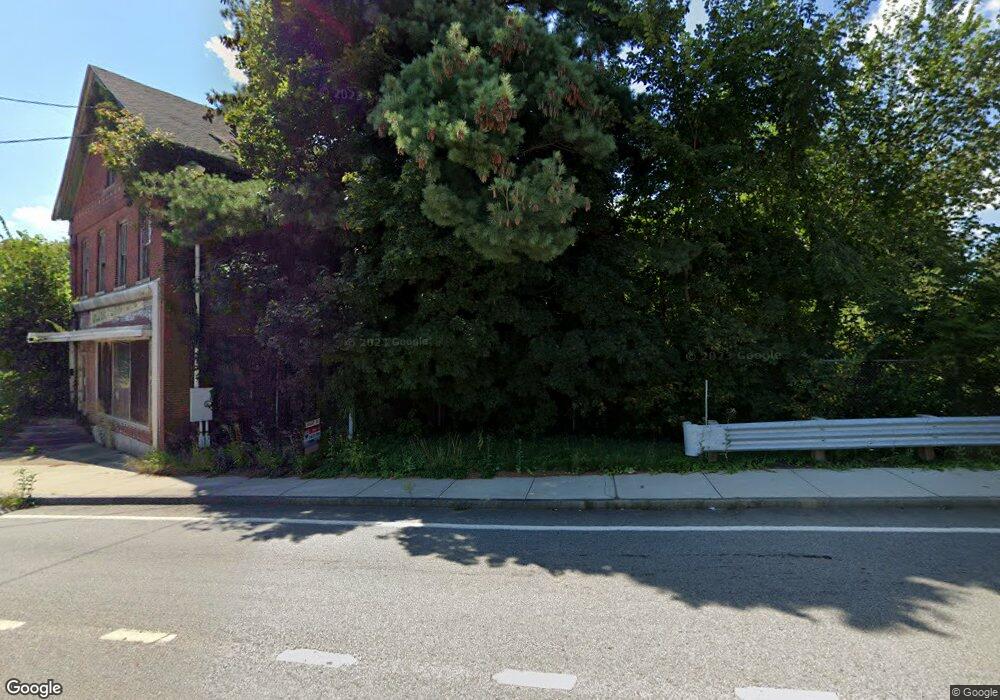
833 Main St Southbridge, MA 01550
Estimated Value: $203,564
Studio
1
Bath
8,494
Sq Ft
$24/Sq Ft
Est. Value
About This Home
This home is located at 833 Main St, Southbridge, MA 01550 and is currently priced at $203,564, approximately $23 per square foot. 833 Main St is a home located in Worcester County with nearby schools including Trinity Catholic Academy.
Ownership History
Date
Name
Owned For
Owner Type
Purchase Details
Closed on
Sep 21, 2005
Sold by
Cloutier Norman O and Cloutier Rita A
Bought by
West Albert C
Current Estimated Value
Home Financials for this Owner
Home Financials are based on the most recent Mortgage that was taken out on this home.
Original Mortgage
$123,000
Outstanding Balance
$65,690
Interest Rate
5.92%
Mortgage Type
Commercial
Purchase Details
Closed on
Apr 17, 1992
Sold by
Cools Inc
Bought by
Cloutier Norman O
Create a Home Valuation Report for This Property
The Home Valuation Report is an in-depth analysis detailing your home's value as well as a comparison with similar homes in the area
Home Values in the Area
Average Home Value in this Area
Purchase History
| Date | Buyer | Sale Price | Title Company |
|---|---|---|---|
| West Albert C | $125,000 | -- | |
| West Albert C | $125,000 | -- | |
| Cloutier Norman O | $5,000 | -- |
Source: Public Records
Mortgage History
| Date | Status | Borrower | Loan Amount |
|---|---|---|---|
| Open | West Albert C | $123,000 | |
| Closed | Cloutier Norman O | $123,000 | |
| Previous Owner | Cloutier Norman O | $70,000 |
Source: Public Records
Tax History Compared to Growth
Tax History
| Year | Tax Paid | Tax Assessment Tax Assessment Total Assessment is a certain percentage of the fair market value that is determined by local assessors to be the total taxable value of land and additions on the property. | Land | Improvement |
|---|---|---|---|---|
| 2025 | $1,771 | $120,800 | $86,900 | $33,900 |
| 2024 | $1,781 | $116,700 | $82,800 | $33,900 |
| 2023 | $1,790 | $113,000 | $82,800 | $30,200 |
| 2022 | $1,858 | $103,800 | $76,100 | $27,700 |
| 2021 | $2,018 | $103,800 | $76,100 | $27,700 |
| 2020 | $2,022 | $103,800 | $76,100 | $27,700 |
| 2018 | $5,814 | $111,100 | $72,400 | $38,700 |
| 2017 | $2,285 | $111,100 | $72,400 | $38,700 |
| 2016 | $2,245 | $111,100 | $72,400 | $38,700 |
| 2015 | $2,107 | $103,500 | $64,800 | $38,700 |
| 2014 | $2,033 | $103,500 | $64,800 | $38,700 |
Source: Public Records
Map
Nearby Homes
- 757 Main St
- 20 Sayles St
- 72 High St
- 6 Walcott St
- 151 West St
- 22 Winter St
- 29 Fiske St
- 20 Glover St
- 20 Newell Ave
- 14 Beech St
- 111 Plimpton St
- 24 Mary Ellen Ln
- 25 Belmont St
- 249 Pleasant St
- 127 Cliff St
- 21 Edwards St
- 216 Fiske St
- 6 Berry Farms Rd Unit 3
- 6 Berry Farms Rd Unit 63
- 6 Berry Farms Rd Unit 64