Estimated Value: $45,000 - $110,000
3
Beds
2
Baths
1,384
Sq Ft
$65/Sq Ft
Est. Value
About This Home
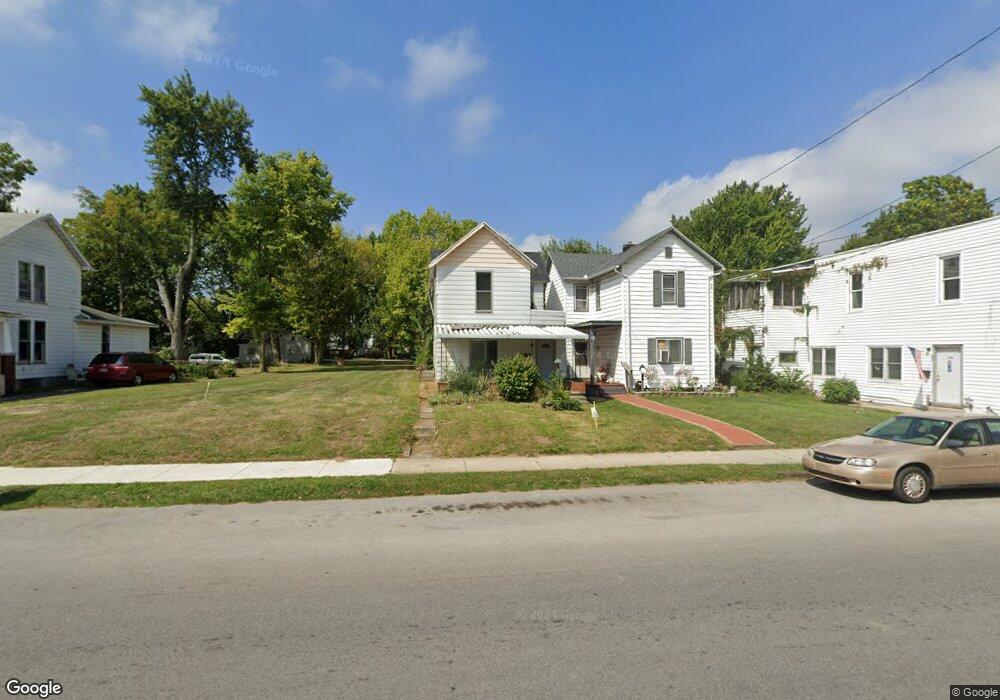
This home is located at 833 N Main St, Lima, OH 45801 and is currently estimated at $89,966, approximately $65 per square foot. 833 N Main St is a home located in Allen County with nearby schools including Independence Elementary School, Lima North Middle School, and Lima West Middle School.
Ownership History
Date
Name
Owned For
Owner Type
Purchase Details
Closed on
May 10, 2013
Sold by
Watkins Willie and Watkins Kaylean
Bought by
Edwards William M
Current Estimated Value
Purchase Details
Closed on
Jan 24, 2002
Sold by
Manufacturers Traders Tr
Bought by
Watkins Kayleen and Watkins Willie
Home Financials for this Owner
Home Financials are based on the most recent Mortgage that was taken out on this home.
Original Mortgage
$11,440
Interest Rate
7.16%
Mortgage Type
New Conventional
Purchase Details
Closed on
Dec 31, 2001
Sold by
Wolever Michael S
Bought by
Manufacturers & Traders Trust Co
Home Financials for this Owner
Home Financials are based on the most recent Mortgage that was taken out on this home.
Original Mortgage
$11,440
Interest Rate
7.16%
Mortgage Type
New Conventional
Purchase Details
Closed on
Jan 1, 1990
Bought by
Mckinney Florence A
Create a Home Valuation Report for This Property
The Home Valuation Report is an in-depth analysis detailing your home's value as well as a comparison with similar homes in the area
Home Values in the Area
Average Home Value in this Area
Purchase History
| Date | Buyer | Sale Price | Title Company |
|---|---|---|---|
| Edwards William M | $3,000 | None Available | |
| Watkins Kayleen | $14,300 | -- | |
| Manufacturers & Traders Trust Co | $12,000 | -- | |
| Mckinney Florence A | -- | -- |
Source: Public Records
Mortgage History
| Date | Status | Borrower | Loan Amount |
|---|---|---|---|
| Previous Owner | Watkins Kayleen | $11,440 |
Source: Public Records
Tax History Compared to Growth
Tax History
| Year | Tax Paid | Tax Assessment Tax Assessment Total Assessment is a certain percentage of the fair market value that is determined by local assessors to be the total taxable value of land and additions on the property. | Land | Improvement |
|---|---|---|---|---|
| 2024 | $792 | $18,310 | $2,000 | $16,310 |
| 2023 | $1,196 | $14,430 | $1,580 | $12,850 |
| 2022 | $937 | $14,430 | $1,580 | $12,850 |
| 2021 | $1,153 | $14,430 | $1,580 | $12,850 |
| 2020 | $678 | $12,500 | $1,510 | $10,990 |
| 2019 | $678 | $12,500 | $1,510 | $10,990 |
| 2018 | $957 | $12,500 | $1,510 | $10,990 |
| 2017 | $1,037 | $12,500 | $1,510 | $10,990 |
| 2016 | $739 | $12,500 | $1,510 | $10,990 |
| 2015 | $702 | $12,500 | $1,510 | $10,990 |
| 2014 | $834 | $11,980 | $1,510 | $10,470 |
| 2013 | $630 | $11,980 | $1,510 | $10,470 |
Source: Public Records
Map
Nearby Homes
- 820 N Main St
- 123 Flanders Ave
- 222 W Grand Ave
- 616 N Elizabeth St
- 939 N West St
- 606 N West St
- 416 Hazel Ave
- 14 House Package
- 622 N Jefferson St
- 708 N Metcalf St
- 612 N Metcalf St
- 1200 N Main St
- 439 E Mckibben St
- 434 N Washington St
- 576 Cortlandt Ave
- 340 W Robb Ave
- 608 W O'Connor Ave
- 325 N McDonel St
- 627 Brice Ave
- 1116 Belvidere Ave