NOT LISTED FOR SALE

833 NW C St Richmond, IN 47374

Estimated Value: $108,000 - $146,000

3 Beds
1 Bath
1,524 Sq Ft
$84/Sq Ft Est. Value

Last Sold September 27, 2019

Last sale price $77,500 $51 Per Sq Ft

Est. 65% increase in value since last sale

Current estimated payment $744/month

About This Home

As of September 2019

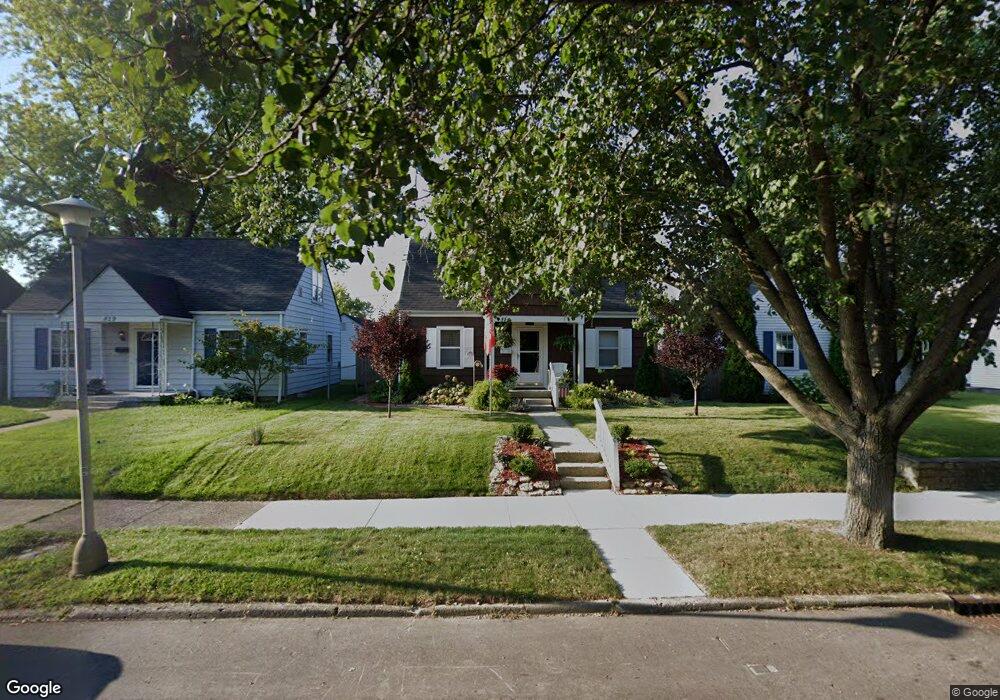
Westside Spacious Bungalow, Ready to move into. Larger eat in kitchen leads to rear covered deck to enjoy the summer nights. 2 Bedrooms on main floor 3rd Bedroom up. Full Basement. Detached garage. New roof. Appliances included.. Call today for a personal tour Debbie Busby 914-7531

Ownership History

Date Name Owned For Owner Type

Purchase Details

Listed on
Jun 12, 2019
Closed on
Sep 27, 2019
Sold by
Johnson Diana L
Bought by
Kincaid David W and Kincaid Patricia L
Seller's Agent
Debbie Busby
Better Homes and Gardens First Realty Group
Buyer's Agent
Rob Johnson
Better Homes and Gardens First Realty Group
List Price
$79,900
Sold Price
$77,500
Premium/Discount to List
-$2,400
-3%
Current Estimated Value
$127,973

Home Financials for this Owner

Home Financials are based on the most recent Mortgage that was taken out on this home.
Estimated Appreciation
$50,473
Avg. Annual Appreciation
8.60%
Original Mortgage
$75,175
Outstanding Balance
$65,857
Interest Rate
3.5%
Mortgage Type
New Conventional
Estimated Equity
$62,116
Source: Public Records

Range of Values:

Collateral Analytics

Collateral Analytics Collateral Analytics AVMs (Automated Valuation Model) employ a number of statistical approaches combined with neighborhood-specific comparable selection guarantees the most up-to-date and precise valuations.

Not Available

Collateral Analytics does not have data for the current month. Please view the chart for historical values.

ICE

ICE Mortgage Technology ICE Mortgage Technology’s AVM (Automated Valuation Model) is a state-of-the-art online residential property valuation tool that provides a quick and accurate estimate of the value of almost any home in the U.S.

Not Available

ICE Mortgage Technology does not have data for the current month. Please view the chart for historical values.

First American

First American First American Data & Analytics’ next-generation AVM combines unrivaled data assets with a blended ensemble of valuation models to produce highly accurate, reliable valuations you can trust.

Not Available

First American does not have data for the current month. Please view the chart for historical values.

Quantarium

Quantarium Quantarium’s valuation service, repeatedly proven the industry’s most accurate and comprehensive, is supercharged with a self-learning and auto-tuning AI engine that continually becomes smarter and more accurate as it processes daily inputs from the industry’s leading RE data lake.

Not Available

Quantarium does not have data for the current month. Please view the chart for historical values.

Average Value
Not Available
List Price
Sold Price
Create a Home Valuation Report for This Property
The Home Valuation Report is an in-depth analysis detailing your home's value as well as a comparison with similar homes in the area

Home Values in the Area

Source: Public Records

Average Home Value in this Area


Source: Public Records

Purchase History

Date Buyer Sale Price Title Company
Kincaid David W -- --
Source: Public Records

Mortgage History

Date Status Borrower Loan Amount
Open Kincaid David W $75,175
Source: Public Records

Property History

Date Event Price List to Sale Price per Sq Ft Prior Sale
09/27/2019 09/27/19 Sold $77,500 -3.0% $51 / Sq Ft View Prior Sale
08/30/2019 08/30/19 Pending -- -- --
06/12/2019 06/12/19 For Sale $79,900 -- $52 / Sq Ft

Tax History Compared to Growth

Source: Public Records

Tax History

Year Tax Paid Tax Assessment Tax Assessment Total Assessment is a certain percentage of the fair market value that is determined by local assessors to be the total taxable value of land and additions on the property. Land Improvement
2024 $881 $88,100 $11,700 $76,400
2023 $773 $77,300 $10,300 $67,000
2022 $800 $80,000 $10,300 $69,700
2021 $690 $74,200 $10,300 $63,900
2020 $652 $74,200 $10,300 $63,900
2019 $569 $69,100 $10,300 $58,800
2018 $92 $69,100 $10,300 $58,800
2017 $101 $68,900 $10,300 $58,600
2016 $111 $70,000 $10,300 $59,700
2014 $68 $66,200 $10,300 $55,900
2013 $68 $62,200 $10,300 $51,900
Source: Public Records

Agents Affiliated with this Home

  • Section Image
  • Section Image
See All Agents

Map