Estimated Value: $379,000 - $843,000
Studio
--
Bath
--
Sq Ft
26,572
Sq Ft
About This Home
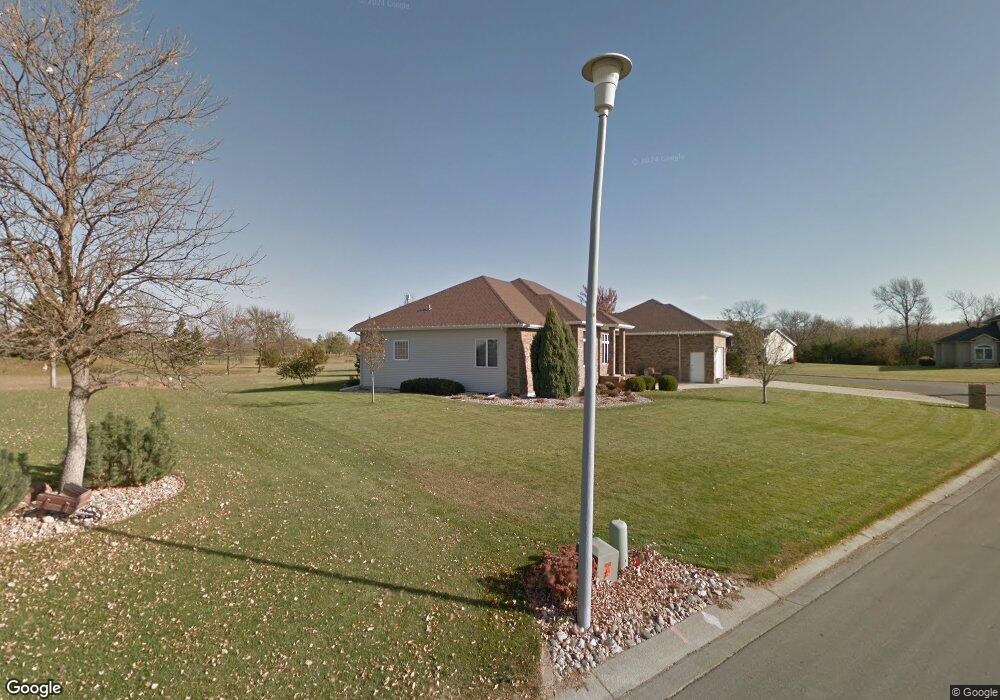
This home is located at 833 Riverbend Rd, Oxbow, ND 58047 and is currently estimated at $611,000. 833 Riverbend Rd is a home located in Cass County with nearby schools including Kindred Elementary School and Kindred High School.
Ownership History
Date
Name
Owned For
Owner Type
Purchase Details
Closed on
Jul 14, 2016
Sold by
Rieger Daniel J and Rodgers Rieger Elena
Bought by
Cass County Joint Water Resource Distru
Current Estimated Value
Purchase Details
Closed on
Jun 29, 2007
Sold by
Dixon Jennifer
Bought by
Rieger Daniel J and Rodgers Rieger Elena
Purchase Details
Closed on
Aug 26, 2005
Sold by
Dixon James Eaton and Dixon Jennifer
Bought by
Dixon Jennifer
Home Financials for this Owner
Home Financials are based on the most recent Mortgage that was taken out on this home.
Original Mortgage
$42,000
Interest Rate
5.89%
Mortgage Type
Credit Line Revolving
Create a Home Valuation Report for This Property
The Home Valuation Report is an in-depth analysis detailing your home's value as well as a comparison with similar homes in the area
Purchase History
| Date | Buyer | Sale Price | Title Company |
|---|---|---|---|
| Cass County Joint Water Resource Distru | -- | None Available | |
| Rieger Daniel J | -- | -- | |
| Dixon Jennifer | -- | -- |
Source: Public Records
Mortgage History
| Date | Status | Borrower | Loan Amount |
|---|---|---|---|
| Previous Owner | Dixon Jennifer | $42,000 | |
| Previous Owner | Dixon Jennifer | $336,000 |
Source: Public Records
Tax History
| Year | Tax Paid | Tax Assessment Tax Assessment Total Assessment is a certain percentage of the fair market value that is determined by local assessors to be the total taxable value of land and additions on the property. | Land | Improvement |
|---|---|---|---|---|
| 2024 | $262 | $0 | $0 | $0 |
| 2023 | $262 | $0 | $0 | $0 |
| 2022 | $262 | $0 | $0 | $0 |
| 2021 | $262 | $0 | $0 | $0 |
| 2020 | $534 | $0 | $0 | $0 |
| 2019 | $534 | $0 | $0 | $0 |
| 2018 | $534 | $0 | $0 | $0 |
| 2017 | $534 | $0 | $0 | $0 |
| 2016 | $6,609 | $262,100 | $22,400 | $239,700 |
| 2015 | $4,897 | $187,200 | $16,000 | $171,200 |
| 2014 | $4,378 | $178,300 | $15,250 | $163,050 |
| 2013 | $4,277 | $168,200 | $14,400 | $153,800 |
Source: Public Records
Map
Nearby Homes
- 204 Oxbow Cir
- 776 Riverbend Rd
- TBD S Schnell Dr
- 1742 160th Ave S
- 8239 Hebgen Dr
- 8233 Hebgen Dr
- ### County Road 17 S
- 1758 108th Ave S
- 1075 Saltwater Way Bypass
- 1025 Saltwater Way
- 9350 and 9124 57th
- 10358 Burgundy Dr
- 10350 Burgundy Dr
- 10342 Burgundy Dr
- 10202 Burgundy Dr
- 1250 76th Ave S
- 10210 73rd St S
- 10219 73rd St S
- 1520 75th Ave S
- 1572 75th Ave S
- 830 Riverbend Rd
- 829 Riverbend Rd
- 828 Riverbend Rd
- 840 Riverbend Rd
- 843 Riverbend Rd
- 821 Riverbend Rd
- 844 Riverbend Rd
- 817 Riverbend Rd
- 848 Riverbend Rd
- 813 Riverbend Rd
- 852 Riverbend Rd
- 816 Riverbend Rd
- 805 Riverbend Rd
- 810 Riverbend Rd
- 749 Riverbend Rd
- 808 Riverbend Rd
- 745 Riverbend Rd
- 752 Riverbend Rd
- 748 Riverbend Rd
- 744 Riverbend Rd
Your Personal Tour Guide
Ask me questions while you tour the home.