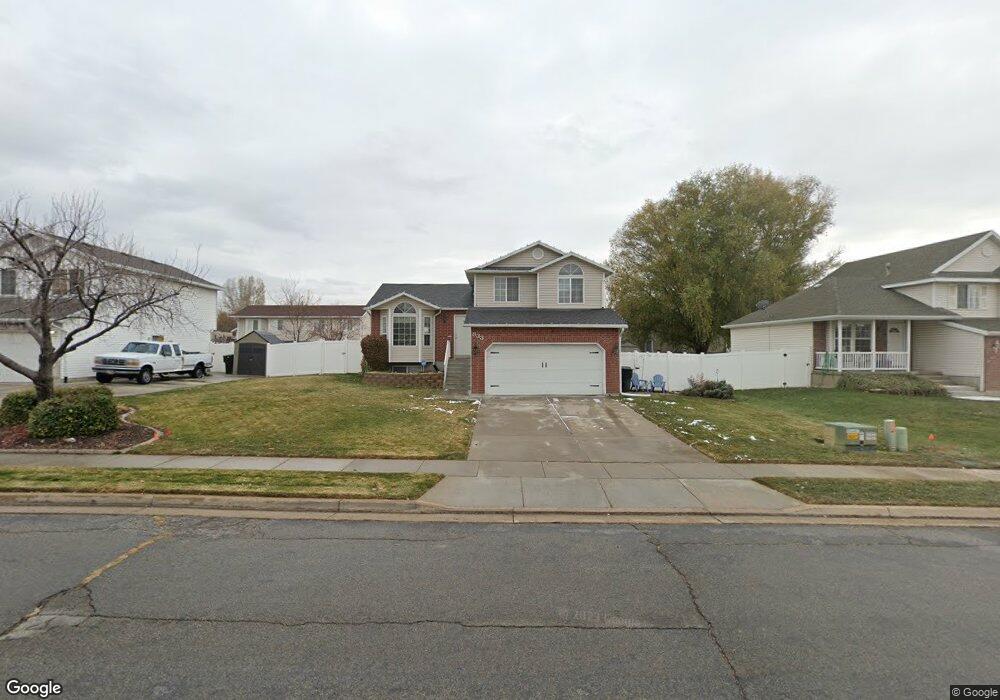
833 W 1520 N Clearfield, UT 84015
Estimated Value: $448,000 - $489,000
3
Beds
3
Baths
1,592
Sq Ft
$294/Sq Ft
Est. Value
About This Home
This home is located at 833 W 1520 N, Clearfield, UT 84015 and is currently estimated at $467,885, approximately $293 per square foot. 833 W 1520 N is a home located in Davis County with nearby schools including Clinton Elementary School, Sunset Junior High School, and Clearfield High School.
Ownership History
Date
Name
Owned For
Owner Type
Purchase Details
Closed on
May 6, 2019
Sold by
Moore Christopher James and Moore Monica Renee
Bought by
Moore Christopher James and Moore Monica Renee
Current Estimated Value
Home Financials for this Owner
Home Financials are based on the most recent Mortgage that was taken out on this home.
Original Mortgage
$28,500
Outstanding Balance
$11,542
Interest Rate
4%
Mortgage Type
Stand Alone Second
Estimated Equity
$456,343
Purchase Details
Closed on
Jan 24, 2018
Sold by
Moore Christopher James and Moore Monica Renee
Bought by
Moore Christopher James and Moore Monica Renee
Home Financials for this Owner
Home Financials are based on the most recent Mortgage that was taken out on this home.
Original Mortgage
$181,600
Interest Rate
3.93%
Mortgage Type
Commercial
Purchase Details
Closed on
Mar 10, 2006
Sold by
Moore Christopher James
Bought by
Moore Christopher James and Moore Monica Renee
Home Financials for this Owner
Home Financials are based on the most recent Mortgage that was taken out on this home.
Original Mortgage
$128,000
Interest Rate
8.25%
Mortgage Type
Stand Alone First
Purchase Details
Closed on
Mar 8, 2006
Sold by
Anderton Jay M and Anderton Jennifer J
Bought by
Moore Christopher James
Home Financials for this Owner
Home Financials are based on the most recent Mortgage that was taken out on this home.
Original Mortgage
$128,000
Interest Rate
8.25%
Mortgage Type
Stand Alone First
Purchase Details
Closed on
Aug 13, 2004
Sold by
Morgenegg Matthew A and Morgenegg Holly E
Bought by
Anderton Jay M and Anderton Jennifer J
Home Financials for this Owner
Home Financials are based on the most recent Mortgage that was taken out on this home.
Original Mortgage
$145,375
Interest Rate
6.17%
Mortgage Type
VA
Purchase Details
Closed on
Feb 4, 1999
Sold by
Shulz Jeffrey
Bought by
Morgenegg Matthew A and Morgenegg Holly E
Purchase Details
Closed on
May 8, 1998
Sold by
Mark Higley Construction Lc
Bought by
Shulz Jeffrey
Create a Home Valuation Report for This Property
The Home Valuation Report is an in-depth analysis detailing your home's value as well as a comparison with similar homes in the area
Home Values in the Area
Average Home Value in this Area
Purchase History
| Date | Buyer | Sale Price | Title Company |
|---|---|---|---|
| Moore Christopher James | -- | Highland Title Ag | |
| Moore Christopher James | -- | Highland Title Ag | |
| Moore Christopher James | -- | -- | |
| Moore Christopher James | -- | Bonneville Title Company | |
| Moore Christopher James | -- | Bonneville Title Company | |
| Anderton Jay M | -- | Bonneville Title Company Inc | |
| Morgenegg Matthew A | -- | Bonneville Title Company | |
| Shulz Jeffrey | -- | First American Title Co |
Source: Public Records
Mortgage History
| Date | Status | Borrower | Loan Amount |
|---|---|---|---|
| Open | Moore Christopher James | $28,500 | |
| Previous Owner | Moore Christopher James | $181,600 | |
| Previous Owner | Moore Christopher James | $128,000 | |
| Previous Owner | Anderton Jay M | $145,375 |
Source: Public Records
Tax History Compared to Growth
Tax History
| Year | Tax Paid | Tax Assessment Tax Assessment Total Assessment is a certain percentage of the fair market value that is determined by local assessors to be the total taxable value of land and additions on the property. | Land | Improvement |
|---|---|---|---|---|
| 2025 | $2,380 | $228,800 | $85,155 | $143,645 |
| 2024 | $2,293 | $221,650 | $94,124 | $127,526 |
| 2023 | $2,069 | $370,000 | $106,177 | $263,823 |
| 2022 | $2,207 | $218,351 | $66,072 | $152,279 |
| 2021 | $2,024 | $297,000 | $80,820 | $216,180 |
| 2020 | $1,756 | $255,000 | $67,689 | $187,311 |
| 2019 | $1,705 | $242,000 | $80,934 | $161,066 |
| 2018 | $1,592 | $222,000 | $68,602 | $153,398 |
| 2016 | $1,385 | $99,716 | $26,505 | $73,211 |
| 2015 | $1,381 | $94,491 | $26,505 | $67,986 |
| 2014 | $1,272 | $88,434 | $26,505 | $61,929 |
| 2013 | -- | $90,678 | $27,143 | $63,535 |
Source: Public Records
Map
Nearby Homes