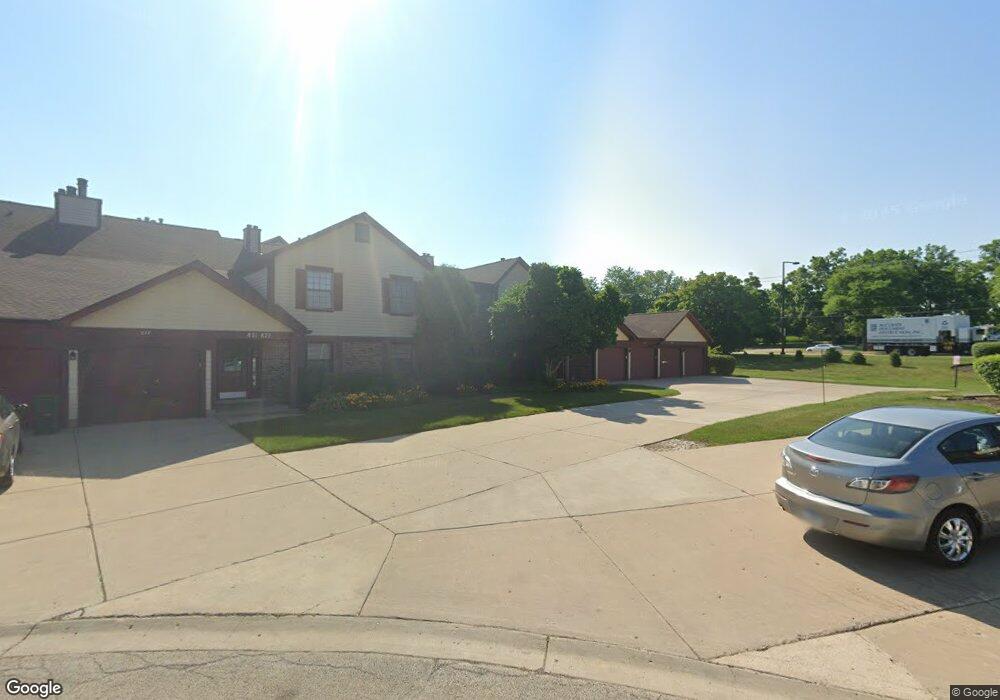
833 Weidner Ct S Unit 2L Buffalo Grove, IL 60089
South Buffalo Grove NeighborhoodEstimated Value: $270,000 - $278,000
2
Beds
2
Baths
1,150
Sq Ft
$238/Sq Ft
Est. Value
About This Home
This home is located at 833 Weidner Ct S Unit 2L, Buffalo Grove, IL 60089 and is currently estimated at $273,695, approximately $237 per square foot. 833 Weidner Ct S Unit 2L is a home located in Cook County with nearby schools including Henry W Longfellow Elementary School, Cooper Middle School, and Buffalo Grove High School.
Ownership History
Date
Name
Owned For
Owner Type
Purchase Details
Closed on
Apr 10, 2024
Sold by
Brykov Ivan
Bought by
Parkway Bank And Trust
Current Estimated Value
Purchase Details
Closed on
Jan 4, 2019
Sold by
Otoole Bonnie E and Anderson Bonnie
Bought by
Brykov Ivan
Home Financials for this Owner
Home Financials are based on the most recent Mortgage that was taken out on this home.
Original Mortgage
$166,840
Interest Rate
5.62%
Mortgage Type
New Conventional
Purchase Details
Closed on
May 30, 2007
Sold by
Shanker Lawrence
Bought by
Anderson Bonnie
Home Financials for this Owner
Home Financials are based on the most recent Mortgage that was taken out on this home.
Original Mortgage
$198,500
Interest Rate
6.21%
Mortgage Type
Unknown
Purchase Details
Closed on
Feb 26, 2001
Sold by
Shanker Robert and Shanker Pauline
Bought by
Shanker Robert
Create a Home Valuation Report for This Property
The Home Valuation Report is an in-depth analysis detailing your home's value as well as a comparison with similar homes in the area
Home Values in the Area
Average Home Value in this Area
Purchase History
| Date | Buyer | Sale Price | Title Company |
|---|---|---|---|
| Parkway Bank And Trust | $236,000 | First American Title | |
| Brykov Ivan | $172,000 | Attorneys Title Guaranty Fun | |
| Anderson Bonnie | $209,000 | Republic Title Company | |
| Shanker Robert | -- | -- |
Source: Public Records
Mortgage History
| Date | Status | Borrower | Loan Amount |
|---|---|---|---|
| Previous Owner | Brykov Ivan | $166,840 | |
| Previous Owner | Anderson Bonnie | $198,500 |
Source: Public Records
Tax History Compared to Growth
Tax History
| Year | Tax Paid | Tax Assessment Tax Assessment Total Assessment is a certain percentage of the fair market value that is determined by local assessors to be the total taxable value of land and additions on the property. | Land | Improvement |
|---|---|---|---|---|
| 2024 | $5,223 | $19,635 | $3,456 | $16,179 |
| 2023 | $4,993 | $19,635 | $3,456 | $16,179 |
| 2022 | $4,993 | $19,635 | $3,456 | $16,179 |
| 2021 | $4,352 | $15,650 | $767 | $14,883 |
| 2020 | $4,314 | $15,650 | $767 | $14,883 |
| 2019 | $5,369 | $17,341 | $767 | $16,574 |
| 2018 | $4,351 | $12,634 | $671 | $11,963 |
| 2017 | $4,271 | $12,634 | $671 | $11,963 |
| 2016 | $3,968 | $12,634 | $671 | $11,963 |
| 2015 | $4,039 | $11,889 | $1,631 | $10,258 |
| 2014 | $3,972 | $11,889 | $1,631 | $10,258 |
| 2013 | $3,672 | $11,889 | $1,631 | $10,258 |
Source: Public Records
Map
Nearby Homes
- 820 Weidner Rd Unit 4013
- 820 Weidner Rd Unit 409
- 665 Thornwood Dr
- 813 Stradford Cir Unit 21B2
- 3300 N Carriageway Dr Unit 317
- 561 Park View Terrace Unit 153
- 859 Beechwood Rd
- 720 Weidner Rd Unit 302
- 535 Estate Dr
- 1127 Miller Ln Unit 107
- 972 Thornton Ln Unit 102
- 1115 Miller Ln Unit 104
- 3157 N Daniels Ct Unit 1502
- 18 E Heritage Ct
- 1225 Radcliffe Rd Unit 2
- 3227 N Heritage Ln
- 3222 N Heritage Ln
- 455 Mayfair Ln
- 410 Chatham Cir
- 408 Indian Hill Dr
- 833 Weidner Ct S Unit 11B2
- 833 Weidner Ct S Unit 833
- 831 Weidner Ct S Unit 11B1
- 835 Weidner Ct S Unit 11A1
- 837 Weidner Ct S Unit 11A2
- 837 Weidner Ct S Unit 837
- 827 Weidner Ct S Unit 11C2
- 825 Weidner Ct S Unit 11C1
- 825 Weidner Ct S Unit 1
- 823 Weidner Ct S Unit 11D2
- 821 Weidner Ct S Unit 11D1
- 651 Hapsfield Ln Unit 201
- 651 Hapsfield Ln Unit 305
- 651 Hapsfield Ln Unit 306
- 651 Hapsfield Ln Unit 202
- 651 Hapsfield Ln Unit 651107
- 651 Hapsfield Ln Unit 651200
- 651 Hapsfield Ln Unit 651206
- 651 Hapsfield Ln Unit 651102
- 651 Hapsfield Ln Unit 651205