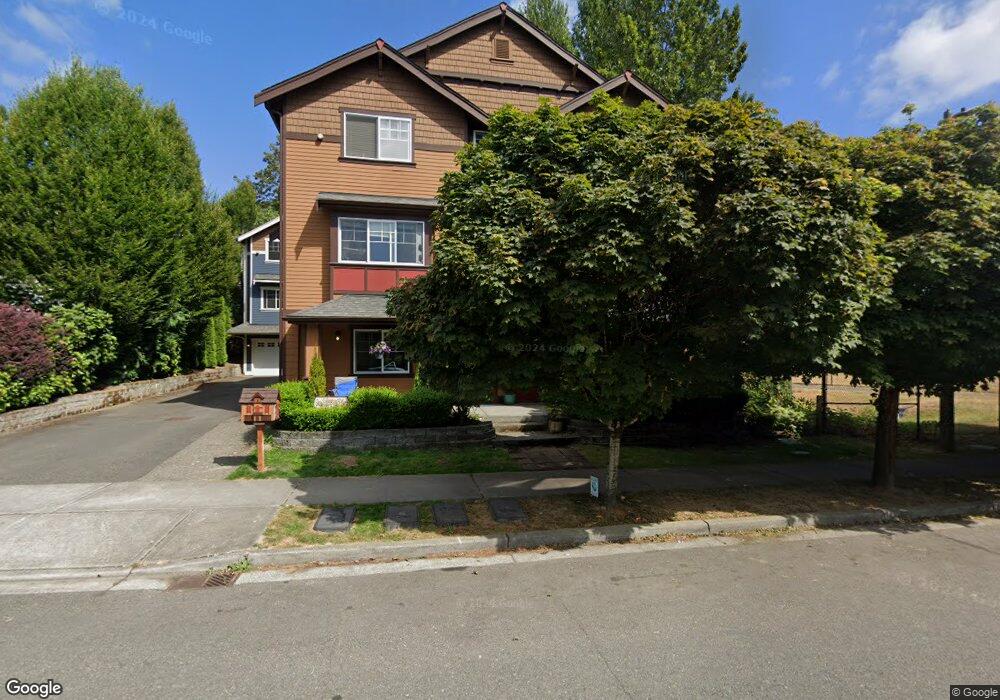
8332 167th Ave NE Unit 83383 Redmond, WA 98052
Downtown Redmond NeighborhoodEstimated Value: $1,123,000 - $1,165,564
3
Beds
4
Baths
2,071
Sq Ft
$549/Sq Ft
Est. Value
About This Home
This home is located at 8332 167th Ave NE Unit 83383, Redmond, WA 98052 and is currently estimated at $1,136,141, approximately $548 per square foot. 8332 167th Ave NE Unit 83383 is a home located in King County with nearby schools including Redmond Elementary School, Redmond Middle School, and Redmond High School.
Ownership History
Date
Name
Owned For
Owner Type
Purchase Details
Closed on
Oct 5, 2024
Sold by
Chablani Manish and Dixit Anupama
Bought by
Zhou Jing and Wu Yulang
Current Estimated Value
Home Financials for this Owner
Home Financials are based on the most recent Mortgage that was taken out on this home.
Original Mortgage
$767,066
Outstanding Balance
$757,405
Interest Rate
5.38%
Mortgage Type
New Conventional
Estimated Equity
$378,736
Purchase Details
Closed on
Sep 8, 2009
Sold by
G S Development Corporation
Bought by
Chablani Manish and Dixit Anupama
Home Financials for this Owner
Home Financials are based on the most recent Mortgage that was taken out on this home.
Original Mortgage
$339,975
Interest Rate
5.2%
Mortgage Type
New Conventional
Create a Home Valuation Report for This Property
The Home Valuation Report is an in-depth analysis detailing your home's value as well as a comparison with similar homes in the area
Home Values in the Area
Average Home Value in this Area
Purchase History
| Date | Buyer | Sale Price | Title Company |
|---|---|---|---|
| Zhou Jing | $1,100,000 | Old Republic Title | |
| Chablani Manish | $453,300 | Chicago Title |
Source: Public Records
Mortgage History
| Date | Status | Borrower | Loan Amount |
|---|---|---|---|
| Open | Zhou Jing | $767,066 | |
| Previous Owner | Chablani Manish | $339,975 |
Source: Public Records
Tax History Compared to Growth
Tax History
| Year | Tax Paid | Tax Assessment Tax Assessment Total Assessment is a certain percentage of the fair market value that is determined by local assessors to be the total taxable value of land and additions on the property. | Land | Improvement |
|---|---|---|---|---|
| 2024 | $8,634 | $1,098,000 | $352,800 | $745,200 |
| 2023 | $10,160 | $1,228,000 | $342,400 | $885,600 |
| 2022 | $7,280 | $1,054,000 | $332,000 | $722,000 |
| 2021 | $6,928 | $846,000 | $290,500 | $555,500 |
| 2020 | $7,462 | $744,000 | $269,800 | $474,200 |
| 2018 | $7,024 | $797,000 | $203,300 | $593,700 |
| 2017 | $6,529 | $703,000 | $174,300 | $528,700 |
| 2016 | $5,384 | $682,000 | $149,400 | $532,600 |
| 2015 | $4,439 | $557,000 | $149,400 | $407,600 |
| 2014 | -- | $443,000 | $128,600 | $314,400 |
| 2013 | -- | $452,000 | $112,000 | $340,000 |
Source: Public Records
Map
Nearby Homes
- 8322 166th Ave NE Unit 3
- 8107 165th Ln NE
- Mansfield Plan at Penny Lane
- Nottingham Plan at Penny Lane
- Durham Plan at Penny Lane
- Stafford B Plan at Penny Lane
- Stafford A Plan at Penny Lane
- 8652 164th Ave NE Unit C109
- 7988 170th Ave Ne (Homesite #14)
- 7986 170th Ave Ne (Homesite #13)
- 7984 170th Ave Ne (Homesite #12)
- 7982 170th Ave Ne (Homesite #11)
- 7978
- 7974 170th Ave Ne (Homesite #7)
- 7972 170th Ave Ne (Homesite #6)
- 7970 170th Ave Ne (Homesite #5)
- 7968 170th Ave Ne (Homesite #4)
- 7966
- 8850 Redmond Woodinville Rd NE Unit 305-
- 17134 NE 84th St
- 8332 167th Ave NE Unit 4
- 8332 167th Ave NE Unit 83384
- 8332 167th Ave NE Unit 83322
- 8332 167th Ave NE Unit 83321
- 8332 167th Ave NE Unit 1
- 8332 167th Ave NE Unit 2
- 8338 167th Ave NE Unit 4
- 8338 167th Ave NE
- 8400 167th Ave NE
- 8321 167th Ave NE Unit 3
- 8321 167th Ave NE Unit 2
- 8321 167th Ave NE Unit B4
- 8321 167th Ave NE Unit A1
- 8321 167th Ave NE Unit A3
- 8321 167th Ave NE Unit A2
- 8321 167th Ave NE Unit A4
- 8321 167th Ave NE Unit B1
- 8321 167th Ave NE Unit B3
- 8321 167th Ave NE Unit B2
- 8321 167th Ave NE Unit 4