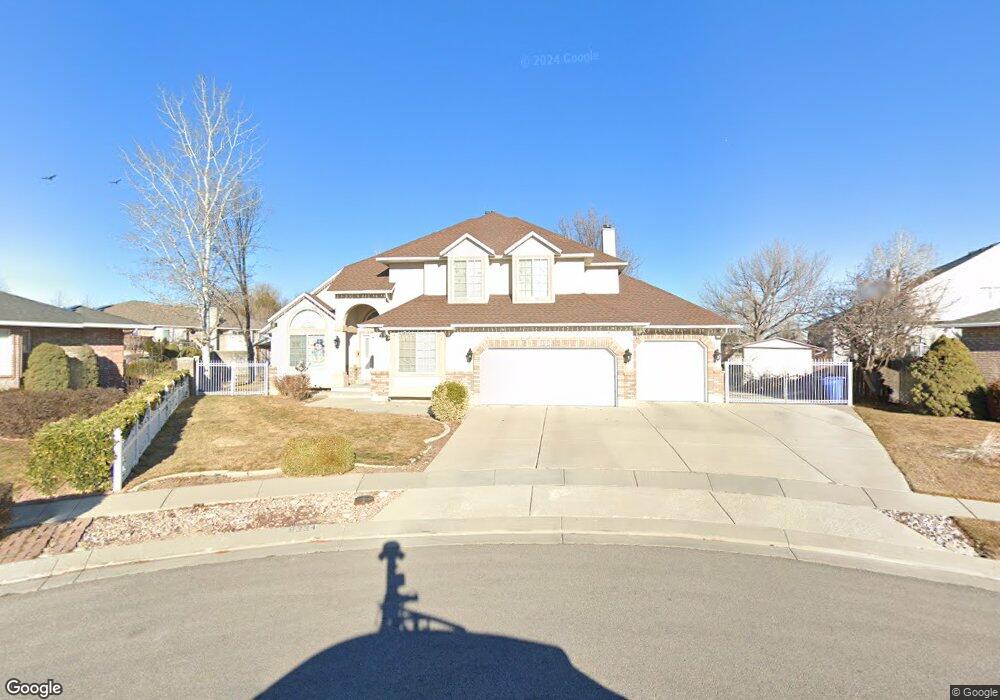
8334 S Witfield Ct West Jordan, UT 84088
Estimated Value: $767,000 - $829,654
7
Beds
4
Baths
4,401
Sq Ft
$181/Sq Ft
Est. Value
About This Home
This home is located at 8334 S Witfield Ct, West Jordan, UT 84088 and is currently estimated at $798,664, approximately $181 per square foot. 8334 S Witfield Ct is a home located in Salt Lake County with nearby schools including Riverside Elementary School, West Jordan Middle School, and West Jordan High School.
Ownership History
Date
Name
Owned For
Owner Type
Purchase Details
Closed on
Jun 23, 2020
Sold by
Kinnersley C Scott C and Kinnersley Marisha D
Bought by
Kinnersley Corey Scott and Kinnersley Marisha Diane
Current Estimated Value
Home Financials for this Owner
Home Financials are based on the most recent Mortgage that was taken out on this home.
Original Mortgage
$350,000
Outstanding Balance
$246,047
Interest Rate
3.2%
Mortgage Type
New Conventional
Estimated Equity
$552,617
Purchase Details
Closed on
Sep 3, 2008
Sold by
Williams Michael D and Williams Deanne M
Bought by
Kinnersley C Scott and Kinnersley Marisha D
Home Financials for this Owner
Home Financials are based on the most recent Mortgage that was taken out on this home.
Original Mortgage
$382,200
Interest Rate
6.59%
Mortgage Type
Purchase Money Mortgage
Purchase Details
Closed on
Jan 18, 1995
Sold by
Kehl Homes Inc
Bought by
Williams Michael D and Williams Deanne M
Home Financials for this Owner
Home Financials are based on the most recent Mortgage that was taken out on this home.
Original Mortgage
$186,000
Interest Rate
9.16%
Create a Home Valuation Report for This Property
The Home Valuation Report is an in-depth analysis detailing your home's value as well as a comparison with similar homes in the area
Home Values in the Area
Average Home Value in this Area
Purchase History
| Date | Buyer | Sale Price | Title Company |
|---|---|---|---|
| Kinnersley Corey Scott | -- | Silver Leaf Title Ins Agcy | |
| Kinnersley C Scott | -- | Inwest Title Services | |
| Williams Michael D | -- | -- | |
| Kehl Homes Inc | -- | -- |
Source: Public Records
Mortgage History
| Date | Status | Borrower | Loan Amount |
|---|---|---|---|
| Open | Kinnersley Corey Scott | $350,000 | |
| Closed | Kinnersley C Scott | $382,200 | |
| Previous Owner | Williams Michael D | $186,000 |
Source: Public Records
Tax History Compared to Growth
Tax History
| Year | Tax Paid | Tax Assessment Tax Assessment Total Assessment is a certain percentage of the fair market value that is determined by local assessors to be the total taxable value of land and additions on the property. | Land | Improvement |
|---|---|---|---|---|
| 2025 | $3,765 | $745,000 | $214,100 | $530,900 |
| 2024 | $3,765 | $724,300 | $208,200 | $516,100 |
| 2023 | $3,765 | $660,300 | $196,400 | $463,900 |
| 2022 | $3,772 | $672,900 | $192,600 | $480,300 |
| 2021 | $3,201 | $519,800 | $150,900 | $368,900 |
| 2020 | $2,984 | $454,800 | $150,900 | $303,900 |
| 2019 | $2,993 | $447,300 | $150,900 | $296,400 |
| 2018 | $2,750 | $407,600 | $120,200 | $287,400 |
| 2017 | $2,607 | $384,800 | $120,200 | $264,600 |
| 2016 | $2,567 | $355,900 | $120,200 | $235,700 |
| 2015 | $2,364 | $319,600 | $128,300 | $191,300 |
| 2014 | $2,252 | $299,700 | $122,500 | $177,200 |
Source: Public Records
Map
Nearby Homes
- 1689 W 8295 S Unit 2
- 1434 Autumn Oak Cir
- 8155 S Redwood Rd Unit 88
- 8155 S Redwood Rd Unit 142B
- 8155 S Redwood Rd Unit 95
- 8155 S Redwood Rd Unit 28
- 8510 S Redwood Rd
- 8518 S Redwood Rd
- 8534 S Redwood Rd
- 1790 W Sugar Factory Rd
- 8686 S Temple Dr
- 1633 W Rockaway Ln
- 1254 W 8680 S
- 1352 W 8780 S
- 1424 Stone Meadow Dr
- 1773 W 8760 S
- 1401 W Stone Meadow Dr
- 8686 Covewood Place
- 8713 Mountain Meadow Dr
- 8772 S Midvalley Dr
- 8334 Witfield Ct
- 8342 Witfield Ct
- 8312 Arlington Ct
- 8333 Stratford Ln
- 8329 Witfield Ct
- 8319 Arlington Ct
- 8345 Stratford Ln
- 8321 Stratford Ln
- 8321 S Stratford Ln
- 8354 Witfield Ct
- 8341 Witfield Ct
- 8357 S Stratford Ln
- 8357 Stratford Ln
- 8309 Stratford Ln
- 8311 S Arlington Ct
- 8311 Arlington Ct
- 8351 Witfield Ct
- 8332 S Shatton Ln
- 8332 Shatton Ln
- 1452 W 8380 S