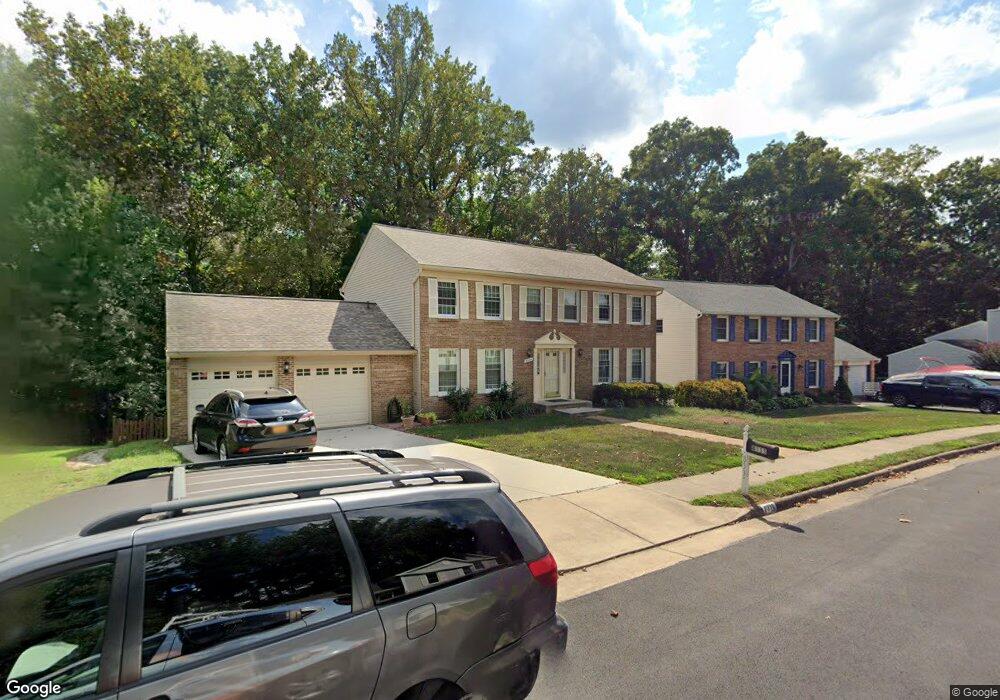
8335 Magic Leaf Rd Springfield, VA 22153
Estimated Value: $843,000 - $867,269
5
Beds
4
Baths
2,352
Sq Ft
$364/Sq Ft
Est. Value
About This Home
This home is located at 8335 Magic Leaf Rd, Springfield, VA 22153 and is currently estimated at $855,567, approximately $363 per square foot. 8335 Magic Leaf Rd is a home located in Fairfax County with nearby schools including Newington Forest Elementary School, South County Middle School, and South County High School.
Ownership History
Date
Name
Owned For
Owner Type
Purchase Details
Closed on
Oct 16, 2002
Sold by
Financia Cendant Mobility
Bought by
Pham Dung
Current Estimated Value
Home Financials for this Owner
Home Financials are based on the most recent Mortgage that was taken out on this home.
Original Mortgage
$280,000
Outstanding Balance
$117,559
Interest Rate
6.18%
Estimated Equity
$738,008
Purchase Details
Closed on
Aug 5, 2002
Sold by
Curran Christopher
Bought by
Cendant Mobility Financial Cor
Purchase Details
Closed on
Aug 7, 2001
Sold by
Sliwa Jo Ann V
Bought by
Curran Christopher F
Home Financials for this Owner
Home Financials are based on the most recent Mortgage that was taken out on this home.
Original Mortgage
$255,200
Interest Rate
7.1%
Create a Home Valuation Report for This Property
The Home Valuation Report is an in-depth analysis detailing your home's value as well as a comparison with similar homes in the area
Home Values in the Area
Average Home Value in this Area
Purchase History
| Date | Buyer | Sale Price | Title Company |
|---|---|---|---|
| Pham Dung | $357,200 | -- | |
| Cendant Mobility Financial Cor | $357,200 | -- | |
| Curran Christopher F | $319,000 | -- |
Source: Public Records
Mortgage History
| Date | Status | Borrower | Loan Amount |
|---|---|---|---|
| Open | Pham Dung | $280,000 | |
| Previous Owner | Curran Christopher F | $255,200 |
Source: Public Records
Tax History
| Year | Tax Paid | Tax Assessment Tax Assessment Total Assessment is a certain percentage of the fair market value that is determined by local assessors to be the total taxable value of land and additions on the property. | Land | Improvement |
|---|---|---|---|---|
| 2025 | $8,542 | $808,350 | $270,000 | $538,350 |
| 2024 | $8,542 | $737,290 | $245,000 | $492,290 |
| 2023 | $8,771 | $777,240 | $245,000 | $532,240 |
| 2022 | $8,065 | $705,290 | $235,000 | $470,290 |
| 2021 | $7,343 | $625,770 | $200,000 | $425,770 |
| 2020 | $6,729 | $568,570 | $185,000 | $383,570 |
| 2019 | $6,729 | $568,570 | $185,000 | $383,570 |
| 2018 | $6,375 | $554,360 | $185,000 | $369,360 |
| 2017 | $6,262 | $539,360 | $170,000 | $369,360 |
| 2016 | $5,946 | $513,250 | $170,000 | $343,250 |
Source: Public Records
Map
Nearby Homes
- 8228 Maple Ridge Ave
- 8225 Burning Forest Ct
- 8461 Rushing Creek Ct
- 8301 Kings Ridge Ct
- 7743 Middle Valley Dr
- 8317 Brookvale Ct
- 7801 Gambrill Rd
- 7920 Journey Ln
- 8010 Rockwood Ct
- 8020 Pohick Rd
- 8677 Hickory Ridge Ct
- 8462 Lazy Creek Ct
- 8504 Silverdale Rd
- 7923 Lake Pleasant Dr
- 8524 Blue Rock Ln
- 8621 Kenosha Ct
- 8274 Raindrop Way
- 8545 Blue Rock Ln
- 8504 Blue Rock Ln
- 7994 Hidden Bridge Dr
- 8337 Magic Leaf Rd
- 8333 Magic Leaf Rd
- 8102 Rolling Knoll Ct
- 8339 Magic Leaf Rd
- 8334 Magic Leaf Rd
- 8106 Rolling Knoll Ct
- 8336 Magic Leaf Rd
- 8332 Magic Leaf Rd
- 8108 Rolling Knoll Ct
- 8331 Magic Leaf Rd
- 8330 Magic Leaf Rd
- 8103 Rolling Knoll Ct
- 8341 Magic Leaf Rd
- 8340 Magic Leaf Rd
- 8105 Rolling Knoll Ct
- 8022 Sunset Path Ct
- 8023 Sunset Path Ct
- 8343 Magic Leaf Rd
- 8110 Rolling Knoll Ct
- 8329 Magic Leaf Rd
Your Personal Tour Guide
Ask me questions while you tour the home.