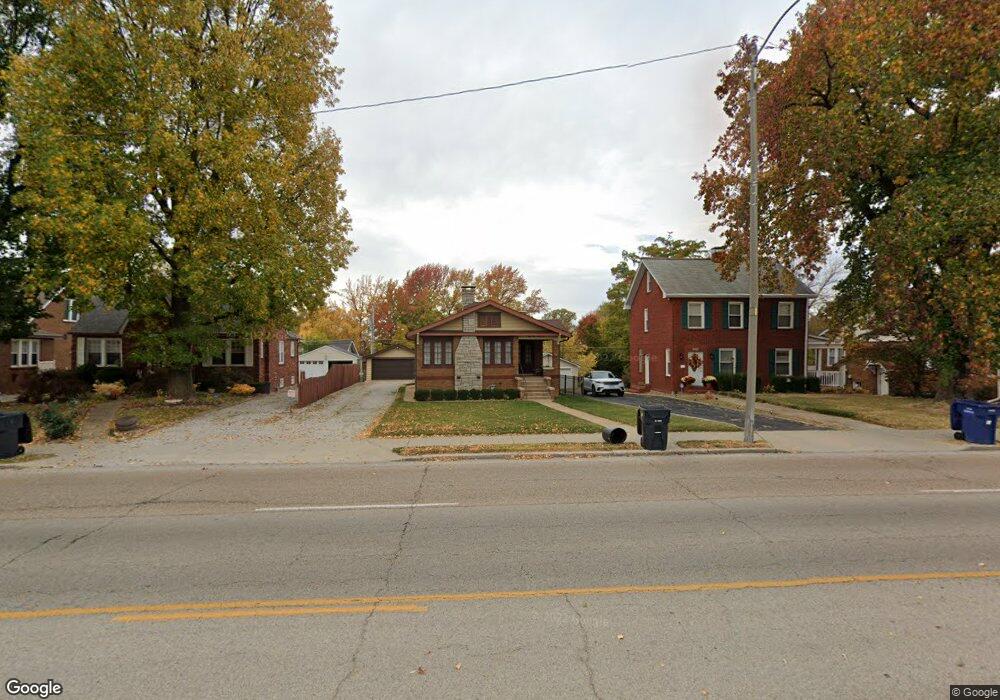
8336 W Main St Belleville, IL 62223
Estimated Value: $129,172 - $194,000
--
Bed
--
Bath
1,436
Sq Ft
$117/Sq Ft
Est. Value
About This Home
This home is located at 8336 W Main St, Belleville, IL 62223 and is currently estimated at $168,293, approximately $117 per square foot. 8336 W Main St is a home located in St. Clair County with nearby schools including Signal Hill Elementary School, Blessed Sacrament Catholic School, and Our Lady Queen Of Peace Catholic School.
Create a Home Valuation Report for This Property
The Home Valuation Report is an in-depth analysis detailing your home's value as well as a comparison with similar homes in the area
Home Values in the Area
Average Home Value in this Area
Tax History Compared to Growth
Tax History
| Year | Tax Paid | Tax Assessment Tax Assessment Total Assessment is a certain percentage of the fair market value that is determined by local assessors to be the total taxable value of land and additions on the property. | Land | Improvement |
|---|---|---|---|---|
| 2024 | $4,310 | $44,134 | $4,141 | $39,993 |
| 2023 | $1,453 | $30,530 | $4,059 | $26,471 |
| 2022 | $1,475 | $27,485 | $3,654 | $23,831 |
| 2021 | $1,532 | $25,409 | $3,378 | $22,031 |
| 2020 | $1,801 | $31,084 | $3,194 | $27,890 |
| 2019 | $1,842 | $28,328 | $3,199 | $25,129 |
| 2018 | $2,167 | $27,716 | $3,130 | $24,586 |
| 2017 | $2,148 | $27,522 | $3,108 | $24,414 |
| 2016 | $2,095 | $26,937 | $3,042 | $23,895 |
| 2014 | $2,350 | $31,603 | $5,837 | $25,766 |
| 2013 | $2,862 | $32,055 | $5,920 | $26,135 |
Source: Public Records
Map
Nearby Homes
- 8118 W A St
- 121 Country Club Place
- 74 Country Club Place
- 45 Sherwood Forest
- 211 Country Club Ln
- 22 Country Club Place
- 102 N 81st St
- 134 N 82nd St
- 23 N 78th St
- 25 S 76th St
- 20 Hilldale Dr
- 121 E Fairway Dr
- 7513 W Main St
- 6 N 95th St
- 24 S 95th St
- 324 N Powder Mill Rd
- 27 Carr Park Rd
- 201 S Fairway Dr
- 7426 Foley Dr
- 7522 Claymont Ct Unit 3