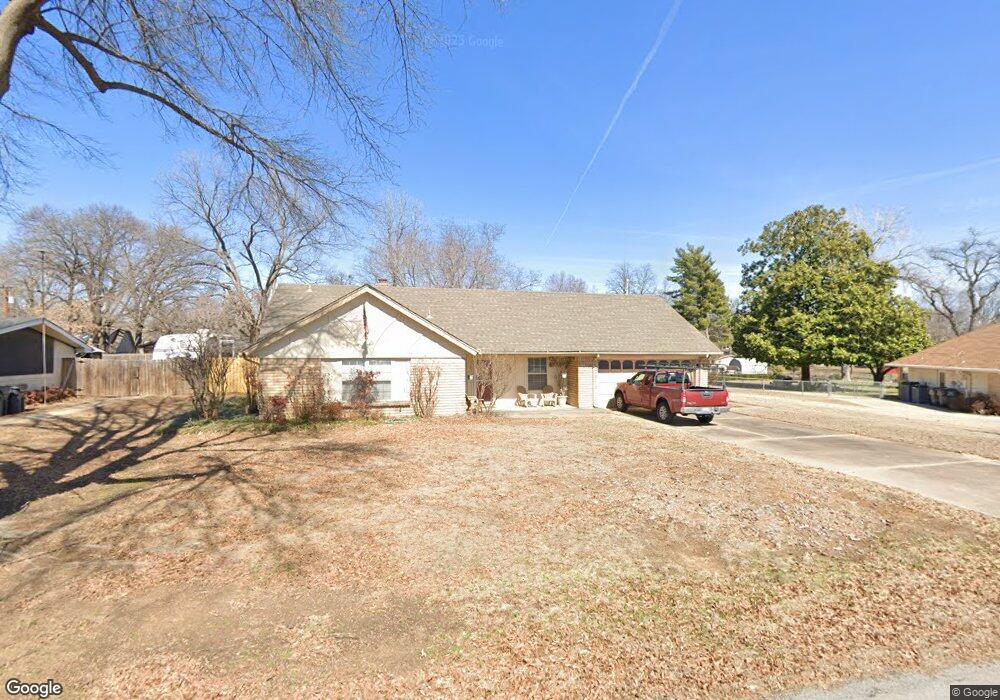
8339 E 117th Place S Bixby, OK 74008
North Bixby NeighborhoodEstimated Value: $230,000 - $289,000
2
Beds
2
Baths
2,095
Sq Ft
$126/Sq Ft
Est. Value
About This Home
This home is located at 8339 E 117th Place S, Bixby, OK 74008 and is currently estimated at $263,597, approximately $125 per square foot. 8339 E 117th Place S is a home located in Tulsa County with nearby schools including Bixby North Elementary, Bixby North Intermediate, and Bixby Middle School.
Ownership History
Date
Name
Owned For
Owner Type
Purchase Details
Closed on
Jul 30, 2018
Sold by
Mcnair Raymond Clark and Mcnair Cheryl Anne
Bought by
Raymond Clark Mcnair And Cheryl Anne Mcnair L and Mcnair
Current Estimated Value
Purchase Details
Closed on
Sep 19, 2008
Sold by
Dumar William and Dumar Ruth Louise
Bought by
Baxter Clyde J and Baxter Delores A
Home Financials for this Owner
Home Financials are based on the most recent Mortgage that was taken out on this home.
Original Mortgage
$118,837
Interest Rate
6.6%
Mortgage Type
FHA
Purchase Details
Closed on
Oct 26, 2004
Sold by
Bosco Jan Del
Bought by
William & Ruth Louise Dumar Revocable Li
Purchase Details
Closed on
Oct 21, 2004
Sold by
Mcnair Raymond C and Mcnair Cheryl A
Bought by
Delbosco Jan
Create a Home Valuation Report for This Property
The Home Valuation Report is an in-depth analysis detailing your home's value as well as a comparison with similar homes in the area
Home Values in the Area
Average Home Value in this Area
Purchase History
| Date | Buyer | Sale Price | Title Company |
|---|---|---|---|
| Raymond Clark Mcnair And Cheryl Anne Mcnair L | -- | None Listed On Document | |
| Raymond Clark Mcnair And Cheryl Anne Mcnair L | -- | None Listed On Document | |
| Baxter Clyde J | $121,000 | First American Title & Abstr | |
| William & Ruth Louise Dumar Revocable Li | $110,000 | First American Title & Abstr | |
| Delbosco Jan | -- | First American Title & Abstr |
Source: Public Records
Mortgage History
| Date | Status | Borrower | Loan Amount |
|---|---|---|---|
| Previous Owner | Baxter Clyde J | $118,837 |
Source: Public Records
Tax History Compared to Growth
Tax History
| Year | Tax Paid | Tax Assessment Tax Assessment Total Assessment is a certain percentage of the fair market value that is determined by local assessors to be the total taxable value of land and additions on the property. | Land | Improvement |
|---|---|---|---|---|
| 2024 | $2,469 | $18,205 | $2,001 | $16,204 |
| 2023 | $2,469 | $18,645 | $2,229 | $16,416 |
| 2022 | $2,403 | $17,102 | $2,471 | $14,631 |
| 2021 | $2,177 | $16,575 | $2,395 | $14,180 |
| 2020 | $2,191 | $16,575 | $2,395 | $14,180 |
| 2019 | $2,182 | $16,447 | $2,377 | $14,070 |
| 2018 | $2,095 | $15,938 | $2,303 | $13,635 |
| 2017 | $2,017 | $16,445 | $2,376 | $14,069 |
| 2016 | $1,993 | $16,445 | $2,376 | $14,069 |
| 2015 | $1,906 | $16,445 | $2,376 | $14,069 |
| 2014 | $1,903 | $16,445 | $2,376 | $14,069 |
Source: Public Records
Map
Nearby Homes
- 11926 S 86th East Ave
- 11850 S 87th East Ave
- 7700 E 118th St S
- 9041 E 117th St S
- 8512 E 121st St S
- 8812 E 121st St S
- 11702 S 75th East Ave
- 7362 E 119th St S
- 7362 E 119th Place S
- 11946 S 90th East Ave
- 8986 E 161st Place S
- 11715 S 94th East Ave
- 8508 E 123rd St S
- 11715 S 93rd Ave E
- 12300 S Memorial Dr
- 11248 S 75th Ave E
- 11285 S 73rd East Place
- 11201 S 74th East Ave
- 9521 E 117th St S
- 8118 E 124th St S
- 8331 E 117th St S
- 8347 E 117th Place S
- 8348 E 117th St S
- 8323 E 117th Place S
- 8340 E 117th St S
- 8352 E 117th St S
- 8354 E 117th Place S
- 8334 E 117th Place S
- 8324 E 117th St S
- 8360 E 117th St S
- 8315 E 117th Place S
- 11720 S 84th East Ave
- 11707 S 84th East Ave
- 8320 E 117th St S
- 8318 E 117th Place S
- 8376 E 117th St S
- 11708 S 85th East Ave
- 8307 E 117th Place S
- 8347 E 117th St S
- 8249 E 118th St S