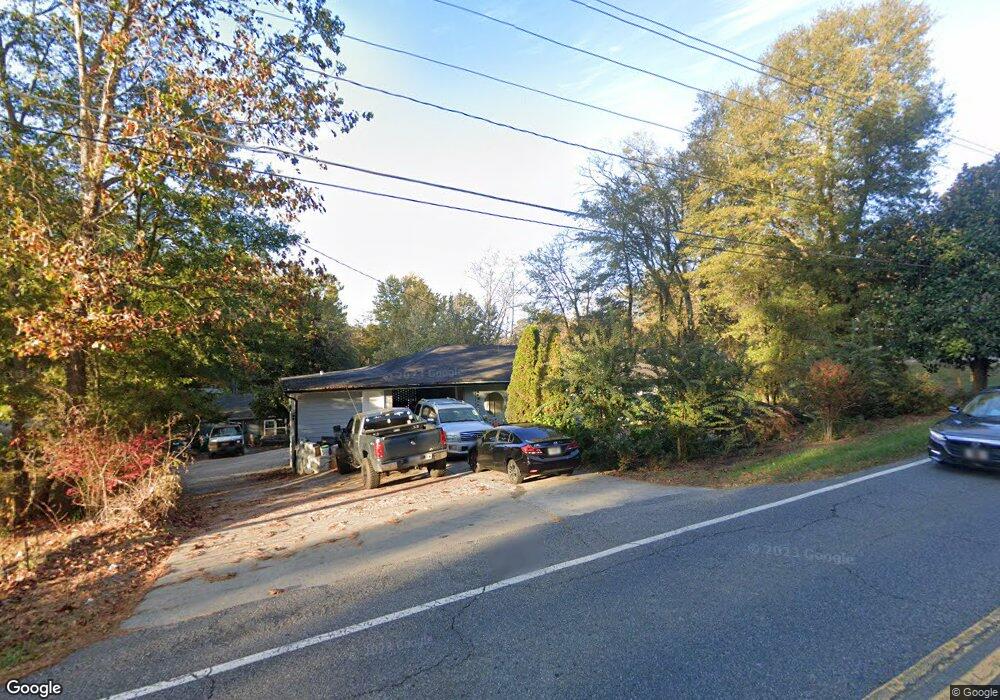
834 Butterworth Rd Canton, GA 30114
Estimated Value: $369,312 - $455,000
4
Beds
3
Baths
3,025
Sq Ft
$136/Sq Ft
Est. Value
About This Home
This home is located at 834 Butterworth Rd, Canton, GA 30114 and is currently estimated at $412,156, approximately $136 per square foot. 834 Butterworth Rd is a home located in Cherokee County with nearby schools including Liberty Elementary School, Freedom Middle School, and Cherokee High School.
Ownership History
Date
Name
Owned For
Owner Type
Purchase Details
Closed on
Aug 30, 1999
Sold by
Bentley Malanie S and Bentley Stanley V
Bought by
Jarquin Bernardino G
Current Estimated Value
Home Financials for this Owner
Home Financials are based on the most recent Mortgage that was taken out on this home.
Original Mortgage
$160,000
Interest Rate
7.5%
Mortgage Type
New Conventional
Purchase Details
Closed on
Aug 14, 1999
Sold by
Lyons Lee M
Bought by
Bentley Melanie S and Bentley Stanley V
Home Financials for this Owner
Home Financials are based on the most recent Mortgage that was taken out on this home.
Original Mortgage
$160,000
Interest Rate
7.5%
Mortgage Type
New Conventional
Purchase Details
Closed on
Mar 30, 1993
Sold by
Dilbeck Carol A Executrix
Bought by
Annala Marie L
Home Financials for this Owner
Home Financials are based on the most recent Mortgage that was taken out on this home.
Original Mortgage
$79,095
Interest Rate
7.7%
Mortgage Type
FHA
Create a Home Valuation Report for This Property
The Home Valuation Report is an in-depth analysis detailing your home's value as well as a comparison with similar homes in the area
Home Values in the Area
Average Home Value in this Area
Purchase History
| Date | Buyer | Sale Price | Title Company |
|---|---|---|---|
| Jarquin Bernardino G | $160,000 | -- | |
| Bentley Melanie S | -- | -- | |
| Annala Marie L | $85,000 | -- |
Source: Public Records
Mortgage History
| Date | Status | Borrower | Loan Amount |
|---|---|---|---|
| Closed | Jarquin Bernardino G | $160,000 | |
| Previous Owner | Annala Marie L | $79,095 |
Source: Public Records
Tax History Compared to Growth
Tax History
| Year | Tax Paid | Tax Assessment Tax Assessment Total Assessment is a certain percentage of the fair market value that is determined by local assessors to be the total taxable value of land and additions on the property. | Land | Improvement |
|---|---|---|---|---|
| 2024 | $3,428 | $143,956 | $23,200 | $120,756 |
| 2023 | $2,827 | $136,360 | $20,000 | $116,360 |
| 2022 | $2,548 | $103,488 | $16,000 | $87,488 |
| 2021 | $2,507 | $93,452 | $16,000 | $77,452 |
| 2020 | $2,167 | $83,220 | $16,000 | $67,220 |
| 2019 | $1,765 | $65,840 | $11,600 | $54,240 |
| 2018 | $1,634 | $59,880 | $11,600 | $48,280 |
| 2017 | $1,669 | $152,100 | $11,600 | $49,240 |
| 2016 | $1,441 | $129,500 | $11,600 | $40,200 |
| 2015 | $1,362 | $121,600 | $9,600 | $39,040 |
| 2014 | $1,333 | $118,900 | $9,600 | $37,960 |
Source: Public Records
Map
Nearby Homes
- 631 Butterworth Rd
- 629 Butterworth Rd
- 106 Henley St
- 135 Henley St
- 129 Henley St
- 138 Henley St Unit 10
- 138 Henley St
- 129 Henley St Unit 67
- 256 Butterworth Rd
- 1521 Larkwood Dr
- 404 Providence Walk St
- 209 Diamond Valley Pass Unit 1
- 342 Providence Walk Way
- 104 Woodland Ln
- 12728A With 1-Acre Bells Ferry Rd
- 152 Gold Mill Place Unit 4F
- 252 Deer Valley Run
- 137 Pecan Dr
- 839 Butterworth Rd
- 157 Pecan Dr
- 874 Butterworth Rd
- 780 Butterworth Rd
- 192 Pecan Dr
- 876 Butterworth Rd
- 183 Diamond Ridge Ave
- 181 Diamond Ridge Ave
- 121 Larosa Dr
- 177 Pecan Dr
- 179 Diamond Ridge Ave
- 177 Diamond Ridge Ave
- 140 Pecan Dr
- 191 Pecan Dr
- 173 Diamond Ridge Ave
- 904 Butterworth Rd
- 0 Pecan Dr
- 0 Pecan Dr Unit 7478769
- 0 Pecan Dr Unit 7249267