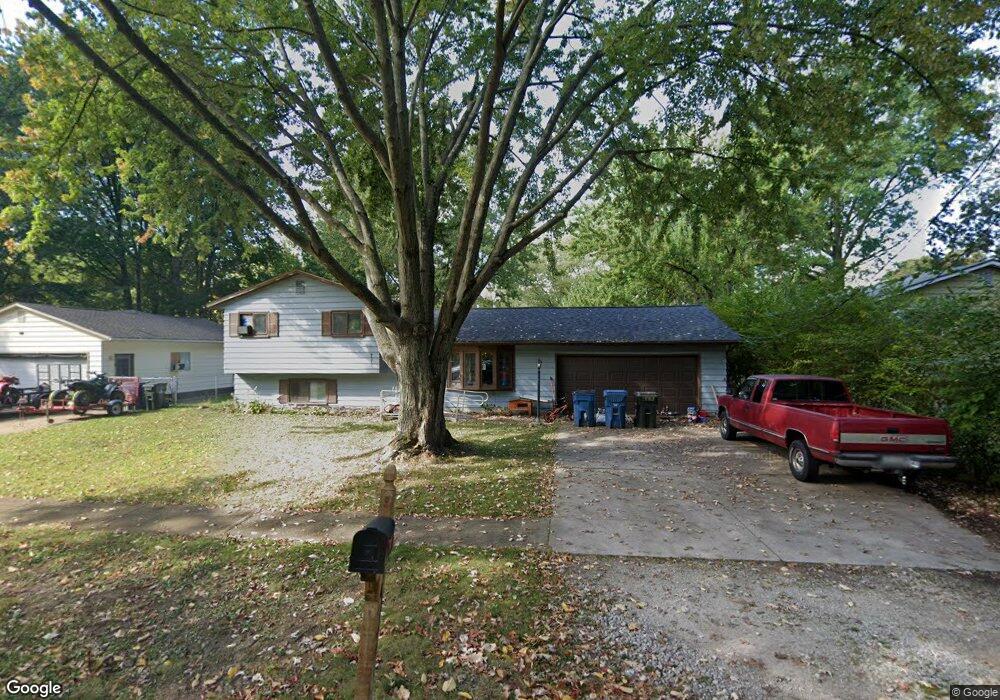
834 Dunny Ave Sheffield Lake, OH 44054
Estimated Value: $190,000 - $227,000
3
Beds
2
Baths
1,368
Sq Ft
$156/Sq Ft
Est. Value
About This Home
This home is located at 834 Dunny Ave, Sheffield Lake, OH 44054 and is currently estimated at $212,810, approximately $155 per square foot. 834 Dunny Ave is a home located in Lorain County with nearby schools including Knollwood Elementary School, Brookside Intermediate School, and Brookside Middle School.
Ownership History
Date
Name
Owned For
Owner Type
Purchase Details
Closed on
Jul 22, 2020
Sold by
Scott Dianne M and Scott Diane M
Bought by
Scott Dianne and The Dianne Scott Revocable Liv
Current Estimated Value
Purchase Details
Closed on
Dec 19, 2006
Sold by
Scott Paul E and Scott Diane M
Bought by
Scott Paul E and Scott Dianne M
Home Financials for this Owner
Home Financials are based on the most recent Mortgage that was taken out on this home.
Original Mortgage
$160,000
Interest Rate
6.27%
Mortgage Type
New Conventional
Purchase Details
Closed on
Oct 29, 2003
Sold by
Muraco Karen D
Bought by
Scott Paul E and Scott Diane M
Home Financials for this Owner
Home Financials are based on the most recent Mortgage that was taken out on this home.
Original Mortgage
$133,600
Interest Rate
5.55%
Mortgage Type
Purchase Money Mortgage
Purchase Details
Closed on
Jun 22, 2002
Sold by
Muraco Ronald A and Muraco Karen D
Bought by
Muraco Ronald A and Muraco Karen D
Create a Home Valuation Report for This Property
The Home Valuation Report is an in-depth analysis detailing your home's value as well as a comparison with similar homes in the area
Home Values in the Area
Average Home Value in this Area
Purchase History
| Date | Buyer | Sale Price | Title Company |
|---|---|---|---|
| Scott Dianne | -- | None Available | |
| Scott Paul E | -- | Attorney | |
| Scott Paul E | $167,000 | Northstar Title Services | |
| Muraco Ronald A | -- | -- |
Source: Public Records
Mortgage History
| Date | Status | Borrower | Loan Amount |
|---|---|---|---|
| Closed | Scott Paul E | $160,000 | |
| Closed | Scott Paul E | $133,600 | |
| Closed | Scott Paul E | $33,400 |
Source: Public Records
Tax History Compared to Growth
Tax History
| Year | Tax Paid | Tax Assessment Tax Assessment Total Assessment is a certain percentage of the fair market value that is determined by local assessors to be the total taxable value of land and additions on the property. | Land | Improvement |
|---|---|---|---|---|
| 2024 | $2,186 | $51,776 | $9,555 | $42,221 |
| 2023 | $2,442 | $41,241 | $10,836 | $30,405 |
| 2022 | $2,419 | $41,241 | $10,836 | $30,405 |
| 2021 | $2,433 | $41,241 | $10,836 | $30,405 |
| 2020 | $2,268 | $35,160 | $9,240 | $25,920 |
| 2019 | $2,254 | $35,160 | $9,240 | $25,920 |
| 2018 | $2,263 | $35,160 | $9,240 | $25,920 |
| 2017 | $2,278 | $32,270 | $3,410 | $28,860 |
| 2016 | $2,299 | $32,270 | $3,410 | $28,860 |
| 2015 | $2,269 | $32,270 | $3,410 | $28,860 |
| 2014 | $1,999 | $31,330 | $3,310 | $28,020 |
| 2013 | $1,989 | $31,330 | $3,310 | $28,020 |
Source: Public Records
Map
Nearby Homes
- 737 Dunny Ave
- 4272 Brockley Ave
- 4260 Brockley Ave
- 0 Kenilworth Ave
- 4154 Belle Ave
- 4283 Holl Ave
- 4286 Holl Ave
- 646 Dunny Ave
- 662 Kenilworth Ave
- 885 Lake Breeze Rd
- 644 Pasadena Ave
- 640 Pasadena Ave
- 738 W Shore Blvd
- VL Maplewood Ave
- 762 Maplewood Ave
- 786 Oliver St
- 580 Alameda Ave
- 0 E Lake Rd
- 4502 Edgewater Dr
- 931 East Dr