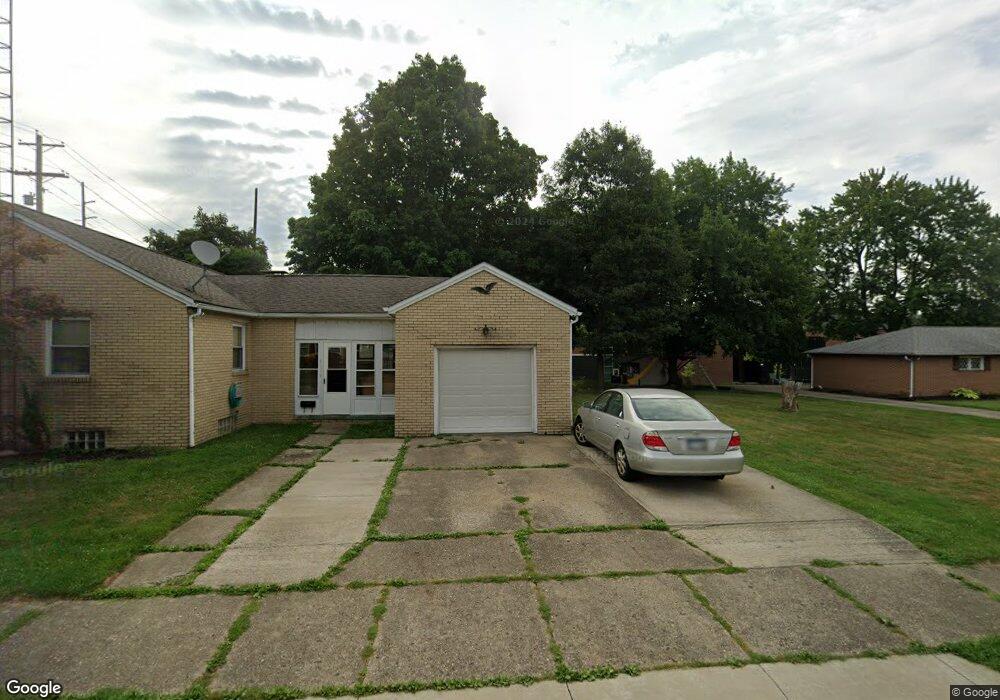
834 E Maple St North Canton, OH 44720
Estimated Value: $189,268 - $215,000
3
Beds
1
Bath
1,232
Sq Ft
$163/Sq Ft
Est. Value
About This Home
This home is located at 834 E Maple St, North Canton, OH 44720 and is currently estimated at $200,567, approximately $162 per square foot. 834 E Maple St is a home located in Stark County with nearby schools including North Canton Middle School, Hoover High School, and St Paul School.
Ownership History
Date
Name
Owned For
Owner Type
Purchase Details
Closed on
Sep 16, 2021
Sold by
Park Kevin J
Bought by
Park Kevin J and Yoho Heather Ann
Current Estimated Value
Purchase Details
Closed on
Aug 18, 2004
Sold by
Mosher Gary A and Mosher Denise A
Bought by
Park Kevin J
Home Financials for this Owner
Home Financials are based on the most recent Mortgage that was taken out on this home.
Original Mortgage
$124,900
Outstanding Balance
$62,347
Interest Rate
6.1%
Mortgage Type
FHA
Estimated Equity
$138,220
Purchase Details
Closed on
Oct 17, 2000
Sold by
Petrovich Cathy and Sponseller Priscilla
Bought by
Mosher Gary A and Mosher Denise A
Home Financials for this Owner
Home Financials are based on the most recent Mortgage that was taken out on this home.
Original Mortgage
$87,300
Interest Rate
7.96%
Mortgage Type
Purchase Money Mortgage
Create a Home Valuation Report for This Property
The Home Valuation Report is an in-depth analysis detailing your home's value as well as a comparison with similar homes in the area
Home Values in the Area
Average Home Value in this Area
Purchase History
| Date | Buyer | Sale Price | Title Company |
|---|---|---|---|
| Park Kevin J | -- | Mk Land Title Inc | |
| Park Kevin J | $125,900 | -- | |
| Mosher Gary A | $97,000 | -- |
Source: Public Records
Mortgage History
| Date | Status | Borrower | Loan Amount |
|---|---|---|---|
| Open | Park Kevin J | $124,900 | |
| Previous Owner | Mosher Gary A | $87,300 |
Source: Public Records
Tax History
| Year | Tax Paid | Tax Assessment Tax Assessment Total Assessment is a certain percentage of the fair market value that is determined by local assessors to be the total taxable value of land and additions on the property. | Land | Improvement |
|---|---|---|---|---|
| 2025 | -- | $49,040 | $14,530 | $34,510 |
| 2024 | -- | $49,040 | $14,530 | $34,510 |
| 2023 | $2,058 | $38,470 | $10,780 | $27,690 |
| 2022 | $1,956 | $38,010 | $10,780 | $27,230 |
| 2021 | $1,887 | $38,010 | $10,780 | $27,230 |
| 2020 | $1,852 | $33,500 | $9,380 | $24,120 |
| 2019 | $1,722 | $33,500 | $9,380 | $24,120 |
Source: Public Records
Map
Nearby Homes
- 534 E Maple St
- 416 Adena St NE
- 1119 Bachtel St SE
- 633 Mckinley Ave SE
- 407 Eastbury Ave NE
- 605 Briar Ave NE
- 1133 Clearmount Ave SE
- 1118 Overridge Ave SE
- 800 Weber Ave NE
- 1321 Clinton Ave SE
- 0 Marquardt Ave
- 945 Royal Oak Ave NE
- 245 James St SW
- 727 Circle Hill Rd SE
- 486 Royer Ave NW
- 0 Marquardt Dr NW
- 455 Royer Ave NW
- 1124 Laurel Green Dr NE
- 1381 Circle Hill Rd SE
- 1509 New England Dr SE
- 842 E Maple St
- 820 E Maple St
- 120 Clearmount Ave SE
- 125 Clearmount Ave SE
- 124 Clearmount Ave SE
- 127 Clearmount Ave SE
- 400 Fredricksburg Ct NE
- 400 Fredricksburg Ct NE
- 124 Woodside Ave SE
- 139 Clearmount Ave SE
- 200 Fredricksburg Ct NE Unit 700
- 132 Woodside Ave SE
- 125 Sutton Ave NE
- 145 Clearmount Ave SE
- 722 E Maple St
- 138 Woodside Ave SE
- 124 Woodside Ave NE
- 500 Fredricksburg Ct NE
- 500 Fredricksburg Ct NE
- 901 E Maple St
Your Personal Tour Guide
Ask me questions while you tour the home.