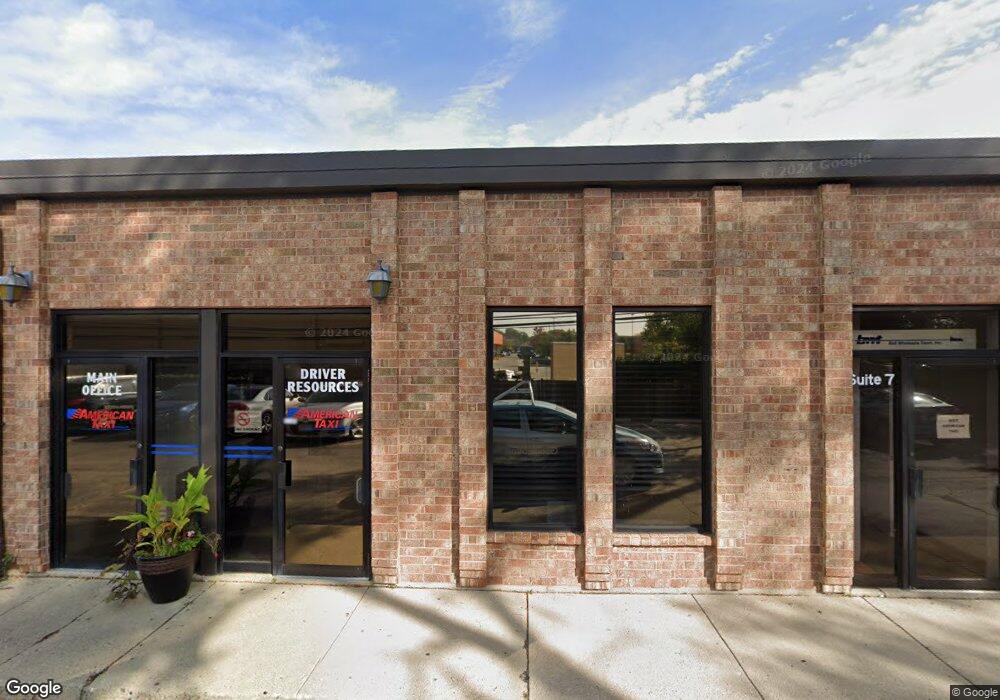
834 E Rand Rd Unit 5 Mount Prospect, IL 60056
North Mount Prospect NeighborhoodEstimated Value: $92,052
Studio
--
Bath
--
Sq Ft
13,155
Sq Ft Lot
About This Home
This home is located at 834 E Rand Rd Unit 5, Mount Prospect, IL 60056 and is currently estimated at $92,052. 834 E Rand Rd Unit 5 is a home located in Cook County with nearby schools including Fairview Elementary School, Lincoln Middle School, and Prospect High School.
Ownership History
Date
Name
Owned For
Owner Type
Purchase Details
Closed on
Feb 9, 2022
Sold by
Achieve Real Estate Inc
Bought by
Pro-Ved Consulting Inc
Current Estimated Value
Purchase Details
Closed on
Aug 7, 2018
Sold by
Browder Carl E and Browder Clara H
Bought by
Achieve Real Estate Group Inc
Purchase Details
Closed on
Jan 26, 2017
Sold by
Browder Carl and Browder Clara
Bought by
Browder Carl E and Browder Clara H
Purchase Details
Closed on
Jan 12, 2007
Sold by
Ryan Jeffrey P
Bought by
Browder Carl and Browder Clara
Purchase Details
Closed on
Jul 30, 2003
Sold by
Royal American Bank
Bought by
Ryan Jeffrey P
Home Financials for this Owner
Home Financials are based on the most recent Mortgage that was taken out on this home.
Original Mortgage
$47,200
Interest Rate
6.5%
Mortgage Type
Commercial
Purchase Details
Closed on
Jan 5, 2003
Sold by
Epm Environmental Inc
Bought by
Royal American Bank and Trust #101052
Create a Home Valuation Report for This Property
The Home Valuation Report is an in-depth analysis detailing your home's value as well as a comparison with similar homes in the area
Home Values in the Area
Average Home Value in this Area
Purchase History
| Date | Buyer | Sale Price | Title Company |
|---|---|---|---|
| Pro-Ved Consulting Inc | $72,500 | -- | |
| Pro-Ved Consulting Inc | $72,500 | -- | |
| Achieve Real Estate Group Inc | $61,500 | Citywide Title Corporation | |
| Browder Carl E | -- | Attorney | |
| Browder Carl | $117,000 | Republic Title Company | |
| Ryan Jeffrey P | $59,000 | Ticor Title Insurance | |
| Royal American Bank | $177,000 | -- |
Source: Public Records
Mortgage History
| Date | Status | Borrower | Loan Amount |
|---|---|---|---|
| Previous Owner | Ryan Jeffrey P | $47,200 |
Source: Public Records
Tax History
| Year | Tax Paid | Tax Assessment Tax Assessment Total Assessment is a certain percentage of the fair market value that is determined by local assessors to be the total taxable value of land and additions on the property. | Land | Improvement |
|---|---|---|---|---|
| 2025 | $5,268 | $24,959 | $3,322 | $21,637 |
| 2024 | $5,268 | $18,947 | $4,429 | $14,518 |
| 2023 | $5,065 | $18,947 | $4,429 | $14,518 |
| 2022 | $5,065 | $18,947 | $4,429 | $14,518 |
| 2021 | $5,598 | $18,000 | $4,428 | $13,572 |
| 2020 | $5,481 | $18,000 | $4,428 | $13,572 |
| 2019 | $5,370 | $19,622 | $4,428 | $15,194 |
| 2018 | $1,633 | $5,353 | $2,878 | $2,475 |
| 2017 | $4,667 | $15,253 | $2,878 | $12,375 |
| 2016 | $4,038 | $15,253 | $2,878 | $12,375 |
| 2015 | $4,435 | $15,298 | $2,767 | $12,531 |
| 2014 | $4,359 | $15,298 | $2,767 | $12,531 |
| 2013 | $4,357 | $15,298 | $2,767 | $12,531 |
Source: Public Records
Map
Nearby Homes
- 1102 E Ardyce Ln
- 103 N Louis St
- 908 E Central Rd
- 1007 Wildwood Ln
- 314 N Owen St
- 1100 N Boxwood Dr Unit P4P5P6
- 1430 E Emmerson Ln
- 406 N Elm St
- 17 S Maple St
- 100 S Emerson St Unit E507
- 475 Amherst Ave
- 512 N Elm St
- 114 S Elm St
- 215 N Main St
- 420 Radcliffe Ave
- 219 Village Dr Unit 29
- 589 Jon Ln
- 220 University Dr Unit 35
- 410 E Garwood Ave
- 612 Maple Ct
- 834 E Rand Rd Unit 1
- 834 E Rand Rd Unit 6
- 834 E Rand Rd Unit 6
- 834 E Rand Rd Unit 13
- 834 E Rand Rd Unit 3
- 834 E Rand Rd Unit 2
- 834 E Rand Rd Unit 12
- 834 E Rand Rd Unit 9
- 834 E Rand Rd Unit 8
- 834 E Rand Rd Unit 4
- 832 E Rand Rd Unit 15
- 832 E Rand Rd Unit 18
- 832 E Rand Rd Unit 20
- 832 E Rand Rd Unit 13-14
- 900 E Ardyce Ln
- 830 E Rand Rd Unit 9
- 830 E Rand Rd Unit 4
- 830 E Rand Rd Unit 7
- 830 E Rand Rd Unit 11
- 901 E Ardyce Ln Unit 2
Your Personal Tour Guide
Ask me questions while you tour the home.