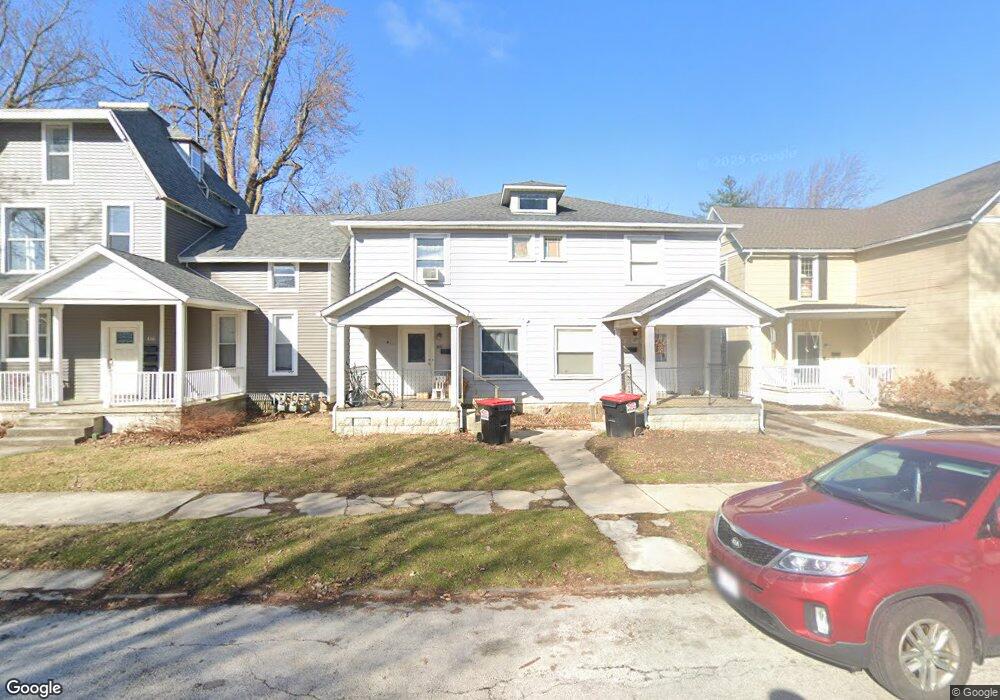
834 Maple Ave Findlay, OH 45840
Estimated Value: $196,455 - $281,000
Studio
4
Baths
3,900
Sq Ft
$62/Sq Ft
Est. Value
About This Home
This home is located at 834 Maple Ave, Findlay, OH 45840 and is currently estimated at $240,364, approximately $61 per square foot. 834 Maple Ave is a home located in Hancock County with nearby schools including Lincoln Elementary School, Donnell Middle School, and Findlay High School.
Ownership History
Date
Name
Owned For
Owner Type
Purchase Details
Closed on
Dec 3, 2024
Sold by
Bengage Properties Ltd
Bought by
Fire Asset Management Llc
Current Estimated Value
Purchase Details
Closed on
May 8, 2013
Sold by
Chambers Douglas L and Chambers Sherri A
Bought by
Bengage Properties Ltd
Purchase Details
Closed on
Jan 30, 1992
Bought by
Chambers Douglas L
Purchase Details
Closed on
Mar 3, 1987
Bought by
Chambers Douglas L and Chambers Kelly
Create a Home Valuation Report for This Property
The Home Valuation Report is an in-depth analysis detailing your home's value as well as a comparison with similar homes in the area
Home Values in the Area
Average Home Value in this Area
Purchase History
| Date | Buyer | Sale Price | Title Company |
|---|---|---|---|
| Fire Asset Management Llc | $230,000 | Whitman Title | |
| Bengage Properties Ltd | -- | Whitman Title Security | |
| Chambers Douglas L | -- | -- | |
| Chambers Douglas L | $30,000 | -- |
Source: Public Records
Tax History
| Year | Tax Paid | Tax Assessment Tax Assessment Total Assessment is a certain percentage of the fair market value that is determined by local assessors to be the total taxable value of land and additions on the property. | Land | Improvement |
|---|---|---|---|---|
| 2024 | $1,967 | $53,950 | $5,300 | $48,650 |
| 2023 | $1,970 | $53,950 | $5,300 | $48,650 |
| 2022 | $1,963 | $53,950 | $5,300 | $48,650 |
| 2021 | $1,602 | $38,360 | $5,300 | $33,060 |
| 2020 | $1,602 | $38,360 | $5,300 | $33,060 |
| 2019 | $1,571 | $38,360 | $5,300 | $33,060 |
| 2018 | $1,375 | $30,770 | $4,240 | $26,530 |
| 2017 | $1,374 | $30,770 | $4,240 | $26,530 |
| 2016 | $1,363 | $30,770 | $4,240 | $26,530 |
| 2015 | $1,562 | $34,720 | $3,640 | $31,080 |
| 2014 | $1,562 | $34,720 | $3,640 | $31,080 |
| 2012 | $2,115 | $46,650 | $3,640 | $43,010 |
Source: Public Records
Map
Nearby Homes
- 829 Maple Ave
- 865 S Main St
- 216 1st St
- 815 Liberty St
- 412 Lima Ave
- 845 Hurd Ave
- 423 Elm St
- 860 Hurd Ave
- 123 Glendale Ave
- 514 Liberty St
- 206 Greenlawn Ave
- 1113 Hurd Ave
- 1304 Douglas Pkwy
- 623 E Sandusky St
- 527 W Sandusky St
- 324 W Mcpherson Ave
- 731 5th St
- 407 Washington St
- 608 W Front St
- 15591 Canadian Way
Your Personal Tour Guide
Ask me questions while you tour the home.