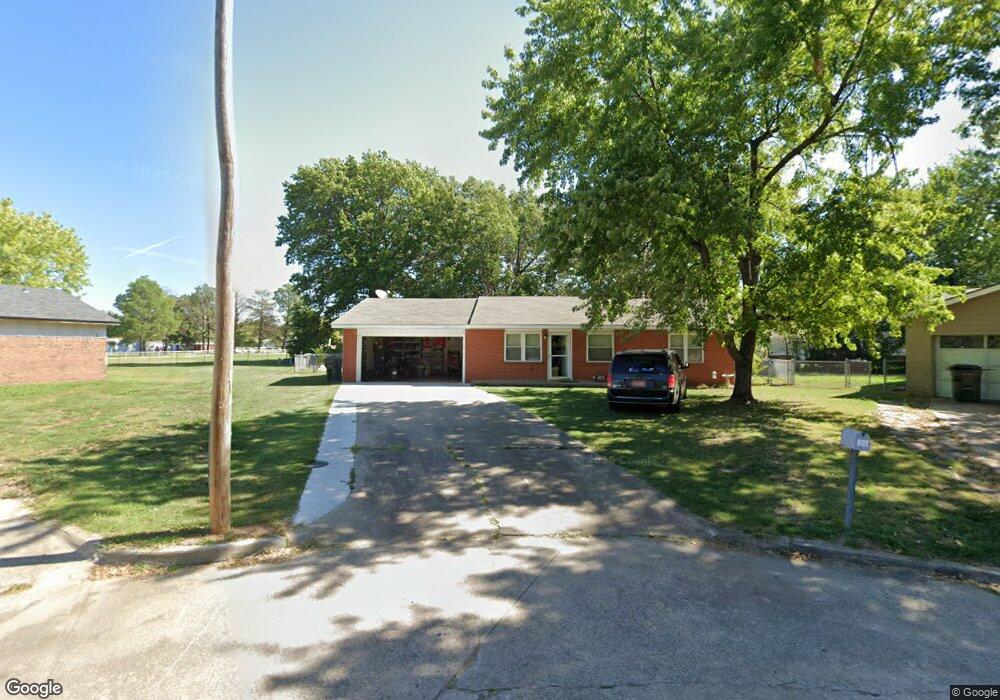
834 Mingo Ct Claremore, OK 74017
Estimated Value: $153,000 - $167,000
3
Beds
2
Baths
972
Sq Ft
$166/Sq Ft
Est. Value
About This Home
This home is located at 834 Mingo Ct, Claremore, OK 74017 and is currently estimated at $161,664, approximately $166 per square foot. 834 Mingo Ct is a home located in Rogers County with nearby schools including Westside Elementary School, Will Rogers Junior High School, and Claremore High School.
Ownership History
Date
Name
Owned For
Owner Type
Purchase Details
Closed on
Nov 21, 2025
Sold by
Mcnair Bobbie and Mcnair Lakisha
Bought by
Jones Ian and Jones Mariah Faith
Current Estimated Value
Home Financials for this Owner
Home Financials are based on the most recent Mortgage that was taken out on this home.
Original Mortgage
$150,350
Outstanding Balance
$150,350
Interest Rate
6.19%
Mortgage Type
New Conventional
Estimated Equity
$11,314
Purchase Details
Closed on
Mar 11, 2024
Sold by
Mackev Bobbv Lee and Mackev Sandy
Bought by
Mcnair Bobbie and Mcnair Lakisha
Home Financials for this Owner
Home Financials are based on the most recent Mortgage that was taken out on this home.
Original Mortgage
$124,173
Interest Rate
6.9%
Mortgage Type
New Conventional
Purchase Details
Closed on
Jun 21, 2022
Sold by
City Of Claremore
Bought by
Mackey Bobby L
Create a Home Valuation Report for This Property
The Home Valuation Report is an in-depth analysis detailing your home's value as well as a comparison with similar homes in the area
Home Values in the Area
Average Home Value in this Area
Purchase History
| Date | Buyer | Sale Price | Title Company |
|---|---|---|---|
| Jones Ian | $155,000 | First American Title | |
| Mcnair Bobbie | $155,000 | None Listed On Document | |
| Mackey Bobby L | $500 | None Listed On Document |
Source: Public Records
Mortgage History
| Date | Status | Borrower | Loan Amount |
|---|---|---|---|
| Open | Jones Ian | $150,350 | |
| Previous Owner | Mcnair Bobbie | $124,173 |
Source: Public Records
Tax History
| Year | Tax Paid | Tax Assessment Tax Assessment Total Assessment is a certain percentage of the fair market value that is determined by local assessors to be the total taxable value of land and additions on the property. | Land | Improvement |
|---|---|---|---|---|
| 2025 | $1,576 | $17,050 | $10,231 | $6,819 |
| 2024 | $1,576 | $8,641 | $2,512 | $6,129 |
| 2023 | $0 | $8,389 | $2,345 | $6,044 |
| 2022 | $0 | $8,144 | $1,980 | $6,164 |
| 2021 | $2,107 | $8,570 | $1,980 | $6,590 |
| 2020 | $0 | $8,446 | $1,980 | $6,466 |
| 2019 | $0 | $8,255 | $1,980 | $6,275 |
| 2018 | $214 | $8,421 | $1,980 | $6,441 |
| 2017 | $0 | $7,938 | $1,980 | $5,958 |
| 2016 | -- | $7,707 | $1,980 | $5,727 |
| 2015 | -- | $7,482 | $1,980 | $5,502 |
| 2014 | -- | $7,264 | $1,980 | $5,284 |
Source: Public Records
Map
Nearby Homes
- 1405 N Lang St
- 0 N J M Davis Blvd
- 1606 N Chambers Terrace
- 1908 N Chambers Terrace
- 119 N Missouri Ave
- 401 W Blue Starr Dr
- 1001 W 22nd St
- 1429 W Evergreen Ln
- 825 W 23rd St N
- 208 N Chambers Trail
- 314 W 7th St
- 1907 N Chambers Ave
- 509 N Weenonah Ave
- 2925 E Holly Rd
- 1110 W 24th St N
- 104 W 7th St
- 1411 N Choctaw Place
- 205 N Kates Ave
- 1520 Greenleaf St
- 1335 N Mcfarland Place