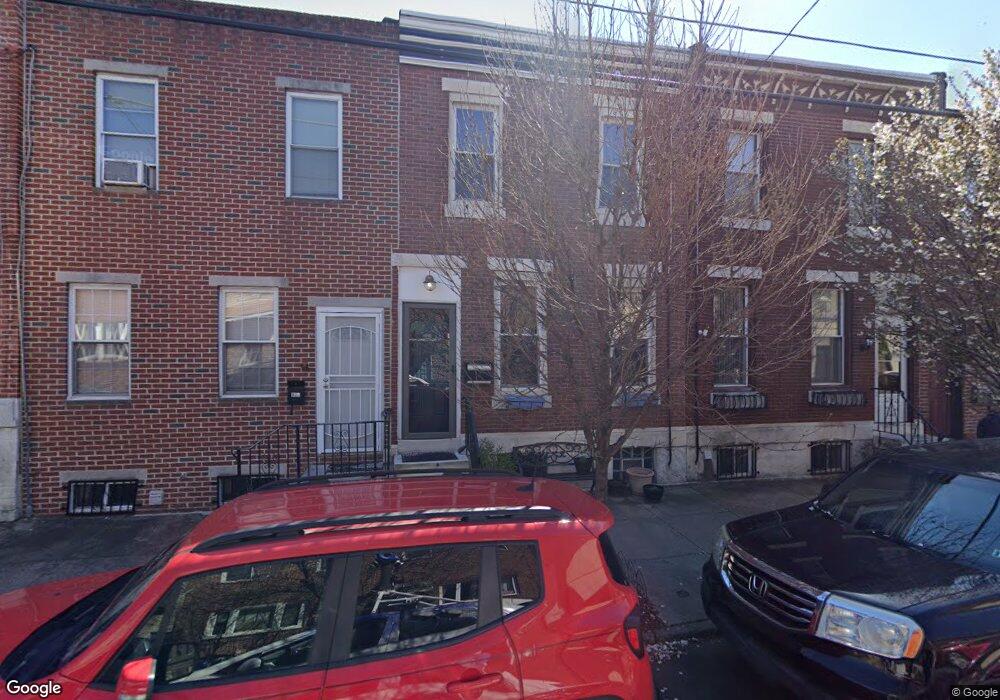
834 Morris St Philadelphia, PA 19148
East Passyunk NeighborhoodEstimated Value: $358,177 - $466,000
3
Beds
1
Bath
1,190
Sq Ft
$328/Sq Ft
Est. Value
About This Home
This home is located at 834 Morris St, Philadelphia, PA 19148 and is currently estimated at $390,044, approximately $327 per square foot. 834 Morris St is a home located in Philadelphia County with nearby schools including Southwark School, South Philadelphia High School, and St. Thomas Aquinas Catholic School.
Ownership History
Date
Name
Owned For
Owner Type
Purchase Details
Closed on
Oct 22, 2011
Sold by
Pecchia Carolyn F and Pecchia Comberiate Carolyn F
Bought by
Barber James P and Barber Amanda M
Current Estimated Value
Purchase Details
Closed on
Dec 28, 2006
Sold by
Chan Yin Savy and Chan Yin Saloeurn
Bought by
Pecchia Carolyn F
Purchase Details
Closed on
Jun 18, 1999
Sold by
Patti Barbara G and Will Of Josephine Gelone
Bought by
Chan Yin Savy and Chan Yin Saloeurn
Create a Home Valuation Report for This Property
The Home Valuation Report is an in-depth analysis detailing your home's value as well as a comparison with similar homes in the area
Home Values in the Area
Average Home Value in this Area
Purchase History
| Date | Buyer | Sale Price | Title Company |
|---|---|---|---|
| Barber James P | $235,000 | None Available | |
| Pecchia Carolyn F | $153,000 | None Available | |
| Chan Yin Savy | $44,500 | -- |
Source: Public Records
Tax History Compared to Growth
Tax History
| Year | Tax Paid | Tax Assessment Tax Assessment Total Assessment is a certain percentage of the fair market value that is determined by local assessors to be the total taxable value of land and additions on the property. | Land | Improvement |
|---|---|---|---|---|
| 2025 | $4,766 | $369,300 | $73,860 | $295,440 |
| 2024 | $4,766 | $369,300 | $73,860 | $295,440 |
| 2023 | $4,766 | $340,500 | $68,100 | $272,400 |
| 2022 | $3,635 | $295,500 | $68,100 | $227,400 |
| 2021 | $4,265 | $0 | $0 | $0 |
| 2020 | $4,265 | $0 | $0 | $0 |
| 2019 | $3,936 | $0 | $0 | $0 |
| 2018 | $3,336 | $0 | $0 | $0 |
| 2017 | $3,336 | $0 | $0 | $0 |
| 2016 | $2,916 | $0 | $0 | $0 |
| 2015 | $2,582 | $0 | $0 | $0 |
| 2014 | -- | $222,700 | $14,560 | $208,140 |
| 2012 | -- | $11,072 | $2,590 | $8,482 |
Source: Public Records
Map
Nearby Homes