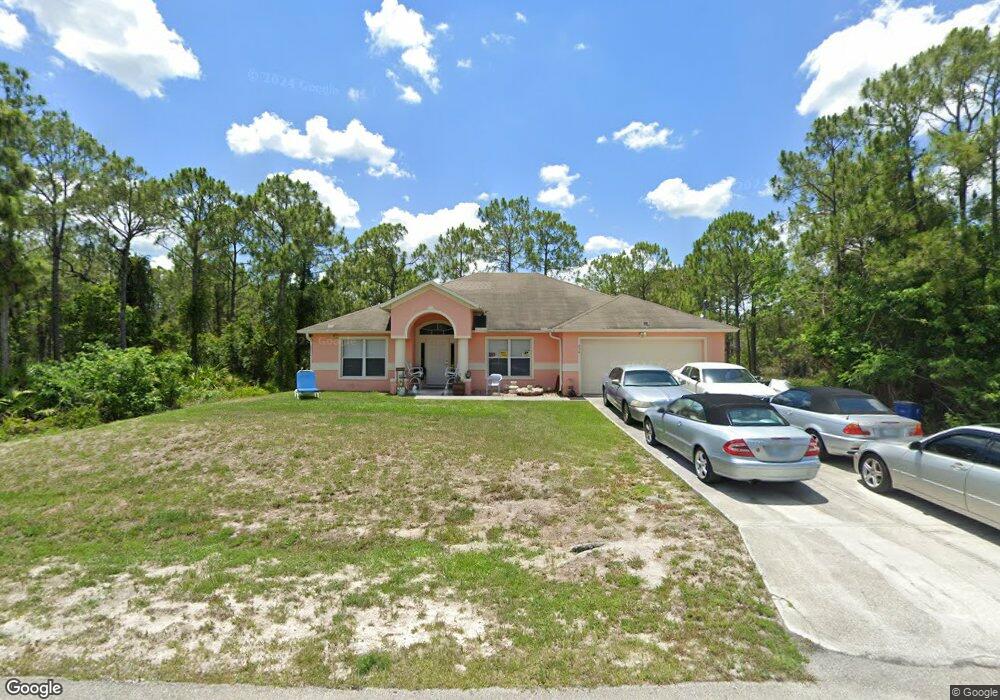
834 Oakridge Ave S Lehigh Acres, FL 33974
Parkdale NeighborhoodEstimated Value: $334,794 - $491,000
4
Beds
2
Baths
2,215
Sq Ft
$181/Sq Ft
Est. Value
About This Home
This home is located at 834 Oakridge Ave S, Lehigh Acres, FL 33974 and is currently estimated at $401,949, approximately $181 per square foot. 834 Oakridge Ave S is a home located in Lee County with nearby schools including Lehigh Elementary School, Gateway Elementary School, and The Alva School.
Ownership History
Date
Name
Owned For
Owner Type
Purchase Details
Closed on
Nov 24, 2009
Sold by
Us Bank National Association
Bought by
Moore Everton and Moore Valrie
Current Estimated Value
Purchase Details
Closed on
Mar 12, 2009
Sold by
Alliance Ronette and Desinor Cociane
Bought by
Us Bank National Association
Purchase Details
Closed on
Jun 19, 2006
Sold by
St Paul Jean O
Bought by
Alliance Ronette
Home Financials for this Owner
Home Financials are based on the most recent Mortgage that was taken out on this home.
Original Mortgage
$325,000
Interest Rate
8.25%
Mortgage Type
Purchase Money Mortgage
Purchase Details
Closed on
Jan 23, 2006
Sold by
Americas First Home Of Southwest Fl Llp
Bought by
St Paul Jean
Home Financials for this Owner
Home Financials are based on the most recent Mortgage that was taken out on this home.
Original Mortgage
$210,391
Interest Rate
7.12%
Mortgage Type
Fannie Mae Freddie Mac
Create a Home Valuation Report for This Property
The Home Valuation Report is an in-depth analysis detailing your home's value as well as a comparison with similar homes in the area
Home Values in the Area
Average Home Value in this Area
Purchase History
| Date | Buyer | Sale Price | Title Company |
|---|---|---|---|
| Moore Everton | $74,500 | Rels Title | |
| Us Bank National Association | -- | Attorney | |
| Alliance Ronette | $325,000 | Attorney | |
| St Paul Jean | $263,000 | Cape Coral Title Insurance A |
Source: Public Records
Mortgage History
| Date | Status | Borrower | Loan Amount |
|---|---|---|---|
| Previous Owner | Alliance Ronette | $325,000 | |
| Previous Owner | St Paul Jean | $210,391 |
Source: Public Records
Tax History
| Year | Tax Paid | Tax Assessment Tax Assessment Total Assessment is a certain percentage of the fair market value that is determined by local assessors to be the total taxable value of land and additions on the property. | Land | Improvement |
|---|---|---|---|---|
| 2025 | $3,741 | $240,378 | -- | -- |
| 2024 | $3,258 | $218,525 | -- | -- |
| 2023 | $3,258 | $198,659 | $0 | $0 |
| 2022 | $3,258 | $180,599 | $0 | $0 |
| 2021 | $2,759 | $181,713 | $4,250 | $177,463 |
| 2020 | $2,642 | $170,396 | $3,750 | $166,646 |
| 2019 | $2,538 | $163,123 | $3,700 | $159,423 |
Source: Public Records
Map
Nearby Homes
- 835 Oakridge Ave S
- 837 Downer Lot 7 Ave S
- 833 Andover Ave S
- 545 Allison St E
- 849 Knox Ave S
- 549 Allison St E
- 521 Allison St E
- 846 Dudley Ave S
- 848 Downer Ave S
- 850 Dudley Ave S
- 849 Ferndale Ave S Unit 13
- 852 Dudley Ave S
- 542 Ames St E
- 804 Oakridge Ave S
- 845 Homestead Rd S
- 812 Homestead Rd S
- 836 Burns Ave S
- 838 Burns Ave S
- 733 Knox Ave S
- 539 Hutton St
- 833 Knox Ave S
- 831 Knox Ave S
- 835 Knox Ave S
- 829 Knox Ave S
- 828 Oakridge Ave S
- 827 Knox Ave S
- 827 Oakridge Ave S
- 827 Oakridge Ave S Unit 14
- 834 Knox Ave
- 836 Knox Ave
- 843 Knox Ave S
- 830 Knox Ave S
- 843 Oakridge Ave S
- 828 Knox Ave S
- 844 Oakridge Ave S
- 533 Allison St E
- 537 Allison St E
- 833 Downer Ave S
- 539 Allison St E
- 835 Downer Ave S Unit 5
Your Personal Tour Guide
Ask me questions while you tour the home.