
Seller's Agent in 2025
Jeff Glover
KW Professionals
(855) 533-3735
4 in this area
2,265 Total Sales
Estimated Value: $135,000 - $164,000
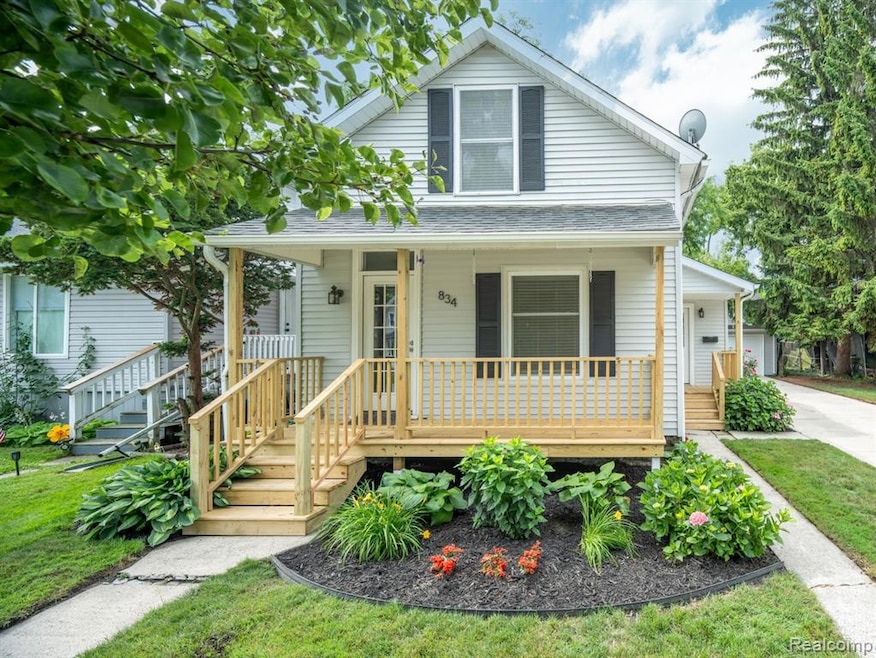
Charming 3-bedroom home located in Port Huron's sought-after Olde Town Historic District. This property features a fully redone front porch and side entry, original architectural details, and bright, spacious living areas. Enjoy a rare, fully fenced backyard, perfect for pets, play, or outdoor entertaining. The home also offers a hard-to-find, updated 2-car garage, providing excellent storage and off-street parking. Ideally situated directly across from a park and just minutes from downtown, Desmond Landing, the Riverwalk, marinas, restaurants, and major highways. A unique opportunity to own a home with space, charm, and a truly walkable location! *****Buyer financing fell-through, their loss is your gain!*****
Last Agent to Sell the Property
KW Professionals License #6501317808 Listed on: 07/12/2025
We collect this data history from publicly available records. To have your information removed, we recommend requesting removal directly through your county’s website.
| Date | Buyer | Sale Price | Title Company |
|---|---|---|---|
| Congdon Robert | $150,000 | None Listed On Document | |
| Sandoval Vickie | $26,000 | -- | |
| Sandoval Vickie | $26,000 | -- | |
| Danik Jacob P | $50,350 | None Available | |
| Port Huron Neighborhood Housing Corp | $51,500 | Wolverton Title Research Co | |
| Secretary Of Housing And Urban Developme | -- | None Available |
We collect this data history from publicly available records. To have your information removed, we recommend requesting removal directly through your county’s website.
| Date | Status | Borrower | Loan Amount |
|---|---|---|---|
| Previous Owner | Danik Jacob P | $40,000 |
| Date | Event | Price | List to Sale | Price per Sq Ft |
|---|---|---|---|---|
| 10/08/2025 10/08/25 | Sold | $150,000 | +0.1% | $141 / Sq Ft |
| 09/22/2025 09/22/25 | Pending | -- | -- | -- |
| 09/10/2025 09/10/25 | For Sale | $149,900 | 0.0% | $141 / Sq Ft |
| 07/18/2025 07/18/25 | Pending | -- | -- | -- |
| 07/12/2025 07/12/25 | For Sale | $149,900 | -- | $141 / Sq Ft |
| Year | Tax Paid | Tax Assessment Tax Assessment Total Assessment is a certain percentage of the fair market value that is determined by local assessors to be the total taxable value of land and additions on the property. | Land | Improvement |
|---|---|---|---|---|
| 2025 | $1,370 | $61,700 | $0 | $0 |
| 2024 | $1,335 | $59,600 | $0 | $0 |
| 2023 | $1,262 | $54,300 | $0 | $0 |
| 2022 | $1,285 | $49,600 | $0 | $0 |
| 2020 | $1,233 | $36,900 | $36,900 | $0 |
| 2019 | $1,212 | $27,600 | $0 | $0 |
| 2018 | $1,185 | $27,600 | $0 | $0 |
| 2017 | $1,059 | $26,700 | $0 | $0 |
| 2016 | $899 | $26,700 | $0 | $0 |
| 2015 | $882 | $26,100 | $26,100 | $0 |
| 2014 | $882 | $24,600 | $24,600 | $0 |
| 2013 | -- | $24,800 | $0 | $0 |
Seller's Agent in 2025
Jeff Glover
KW Professionals
(855) 533-3735
4 in this area
2,265 Total Sales
Seller Co-Listing Agent in 2025
Kristin Nouhan
Keller Williams First
(586) 481-5994
2 in this area
39 Total Sales
Source: Realcomp
MLS Number: 20251016242
APN: 06-743-0309-000
Disclaimer: Certain information contained herein is derived from information provided by parties other than Homes.com. All information provided is deemed reliable, but is not guaranteed to be accurate and should be independently verified.
![]() IDX provided courtesy of Realcomp II Ltd. via Ten-X and MLS
IDX provided courtesy of Realcomp II Ltd. via Ten-X and MLS
Copyright 2026 Realcomp II Ltd. Shareholders
IDX information is provided exclusively for consumers' personal, noncommercial use and may not be used for any purpose other than to identify prospective properties consumers may be interested in purchasing. The accuracy of all information, regardless of source, is not guaranteed or warranted. All information should be independently verified.
Listing Information presented by local MLS brokerage: Ten-X, local REALTOR®- Arlene Richardson - (888)-952-6393
Ask me questions while you tour the home.