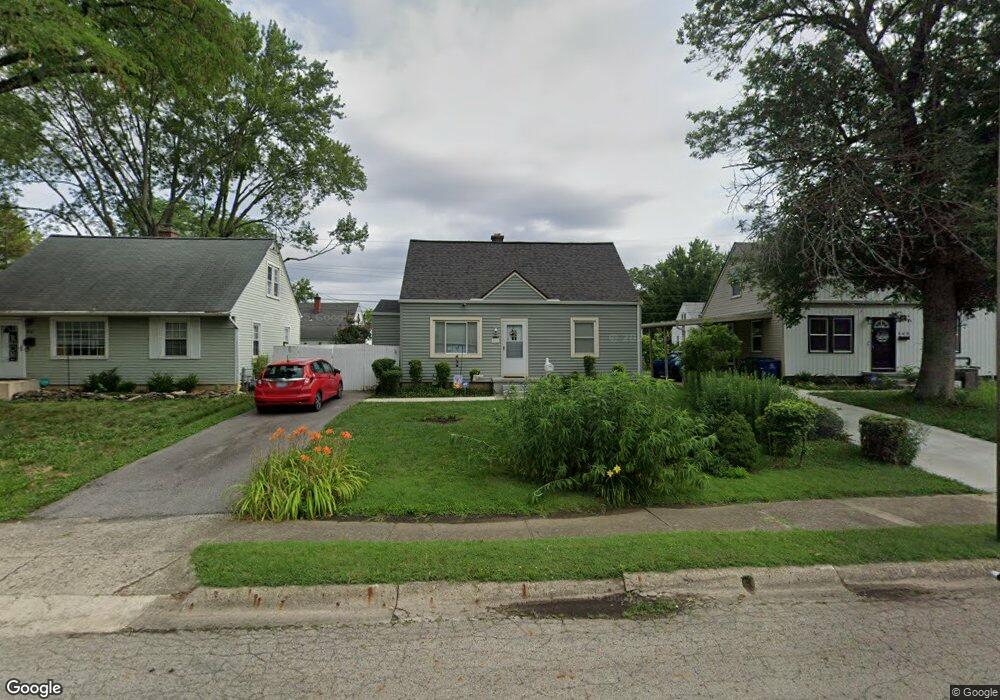
834 Wainwright Dr Columbus, OH 43224
North Linden NeighborhoodEstimated Value: $193,675 - $223,000
3
Beds
1
Bath
1,054
Sq Ft
$198/Sq Ft
Est. Value
About This Home
This home is located at 834 Wainwright Dr, Columbus, OH 43224 and is currently estimated at $208,669, approximately $197 per square foot. 834 Wainwright Dr is a home located in Franklin County with nearby schools including Como Elementary School, Dominion Middle School, and Whetstone High School.
Ownership History
Date
Name
Owned For
Owner Type
Purchase Details
Closed on
Feb 20, 2007
Sold by
Wood Aaron
Bought by
Cyr Michael N and Cyr Dawn K
Current Estimated Value
Home Financials for this Owner
Home Financials are based on the most recent Mortgage that was taken out on this home.
Original Mortgage
$96,000
Outstanding Balance
$56,713
Interest Rate
6.28%
Mortgage Type
VA
Estimated Equity
$151,956
Purchase Details
Closed on
Jun 7, 2006
Sold by
Hulbert Richard L and Hulbert Colleen M
Bought by
Wood Aaron
Purchase Details
Closed on
Sep 7, 2001
Sold by
Donaldson Roger L and Donaldson Donna J
Bought by
Hulbert Richard L and Hulbert Colleen M
Home Financials for this Owner
Home Financials are based on the most recent Mortgage that was taken out on this home.
Original Mortgage
$57,000
Interest Rate
7.06%
Mortgage Type
Purchase Money Mortgage
Create a Home Valuation Report for This Property
The Home Valuation Report is an in-depth analysis detailing your home's value as well as a comparison with similar homes in the area
Home Values in the Area
Average Home Value in this Area
Purchase History
We collect this data history from publicly available records. To have your information removed, we recommend requesting removal directly through your county’s website.
| Date | Buyer | Sale Price | Title Company |
|---|---|---|---|
| Cyr Michael N | $96,000 | Title First | |
| Wood Aaron | $72,000 | Lll Title | |
| Hulbert Richard L | $67,000 | Chicago Title |
Source: Public Records
Mortgage History
We collect this data history from publicly available records. To have your information removed, we recommend requesting removal directly through your county’s website.
| Date | Status | Borrower | Loan Amount |
|---|---|---|---|
| Open | Cyr Michael N | $96,000 | |
| Previous Owner | Hulbert Richard L | $57,000 |
Source: Public Records
Tax History
| Year | Tax Paid | Tax Assessment Tax Assessment Total Assessment is a certain percentage of the fair market value that is determined by local assessors to be the total taxable value of land and additions on the property. | Land | Improvement |
|---|---|---|---|---|
| 2025 | $2,572 | $57,300 | $15,400 | $41,900 |
| 2024 | $2,572 | $57,300 | $15,400 | $41,900 |
| 2023 | $2,539 | $57,295 | $15,400 | $41,895 |
| 2022 | $1,659 | $31,990 | $5,740 | $26,250 |
| 2021 | $1,662 | $31,990 | $5,740 | $26,250 |
| 2020 | $1,664 | $31,990 | $5,740 | $26,250 |
| 2019 | $1,650 | $27,200 | $4,800 | $22,400 |
| 2018 | $1,477 | $27,200 | $4,800 | $22,400 |
| 2017 | $1,545 | $27,200 | $4,800 | $22,400 |
| 2016 | $1,440 | $21,740 | $3,680 | $18,060 |
| 2015 | $1,307 | $21,740 | $3,680 | $18,060 |
| 2014 | $1,311 | $21,740 | $3,680 | $18,060 |
| 2013 | $718 | $24,150 | $4,095 | $20,055 |
Source: Public Records
Map
Nearby Homes
- 845 Weldon Ave
- 826 E Brighton Rd
- 3049 Hiawatha St
- 788 E Tibet Rd
- 2849 Osceola Ave
- 3028 Hiawatha St
- 2905 Hiawatha St
- 3264 Eisenhower Rd
- 983 Mohican Ave
- 2781 Pontiac St
- 603 Midgard Rd
- 2805 Beulah Rd
- 2872 Howey Rd
- 2897 Grasmere Ave
- 551 Melrose Ave
- 3081 Grasmere Ave
- 578 E Tulane Rd
- 746 Oakland Park Ave
- 2950 Grasmere Ave
- 2708 Pontiac St
- 840 Wainwright Dr
- 828 Wainwright Dr
- 846 Wainwright Dr
- 837 E Longview Ave
- 822 Wainwright Dr
- 843 E Longview Ave
- 849 E Longview Ave
- 827 E Longview Ave
- 852 Wainwright Dr
- 831 Wainwright Dr
- 825 Wainwright Dr
- 837 Wainwright Dr
- 816 Wainwright Dr
- 855 E Longview Ave
- 819 Wainwright Dr
- 843 Wainwright Dr
- 821 E Longview Ave
- 858 Wainwright Dr
- 849 Wainwright Dr
- 861 E Longview Ave
Your Personal Tour Guide
Ask me questions while you tour the home.