Estimated Value: $574,000 - $644,000
5
Beds
2
Baths
1,116
Sq Ft
$537/Sq Ft
Est. Value
About This Home
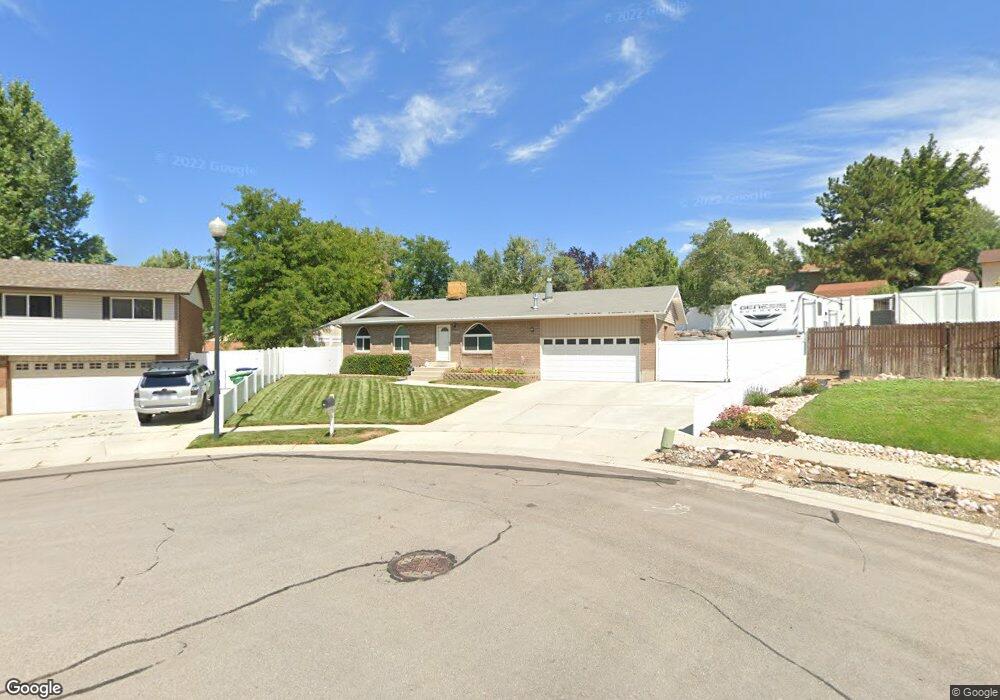
This home is located at 8343 Grambling Way, Sandy, UT 84094 and is currently estimated at $599,332, approximately $537 per square foot. 8343 Grambling Way is a home located in Salt Lake County with nearby schools including East Sandy School, Hillcrest High School, and Union Middle School.
Ownership History
Date
Name
Owned For
Owner Type
Purchase Details
Closed on
Jan 13, 2011
Sold by
Burnhope Scott and Burnhope Stacy
Bought by
Burnhope Scott and Burnhope Stacy
Current Estimated Value
Home Financials for this Owner
Home Financials are based on the most recent Mortgage that was taken out on this home.
Original Mortgage
$77,000
Interest Rate
4.43%
Mortgage Type
New Conventional
Purchase Details
Closed on
Nov 20, 2006
Sold by
Soto Eugenio and Soto Morevia
Bought by
Ehlers Jason E and Ehlers Keri L
Purchase Details
Closed on
Aug 24, 1998
Sold by
Burnhope Scott K
Bought by
Burnhope Scott and Burnhope Stacy
Home Financials for this Owner
Home Financials are based on the most recent Mortgage that was taken out on this home.
Original Mortgage
$88,000
Interest Rate
6.91%
Purchase Details
Closed on
Nov 22, 1993
Sold by
Burnhope Scott K and Bell Stacy
Bought by
Burnhope Scott K and Burnhope Stacy
Home Financials for this Owner
Home Financials are based on the most recent Mortgage that was taken out on this home.
Original Mortgage
$84,429
Interest Rate
6.85%
Mortgage Type
FHA
Create a Home Valuation Report for This Property
The Home Valuation Report is an in-depth analysis detailing your home's value as well as a comparison with similar homes in the area
Home Values in the Area
Average Home Value in this Area
Purchase History
| Date | Buyer | Sale Price | Title Company |
|---|---|---|---|
| Burnhope Scott | -- | Integrated Title Ins Svcs | |
| Ehlers Jason E | -- | First American Title | |
| Burnhope Scott | -- | -- | |
| Burnhope Scott K | -- | -- |
Source: Public Records
Mortgage History
| Date | Status | Borrower | Loan Amount |
|---|---|---|---|
| Closed | Burnhope Scott | $77,000 | |
| Previous Owner | Burnhope Scott | $88,000 | |
| Previous Owner | Burnhope Scott K | $84,429 |
Source: Public Records
Tax History
| Year | Tax Paid | Tax Assessment Tax Assessment Total Assessment is a certain percentage of the fair market value that is determined by local assessors to be the total taxable value of land and additions on the property. | Land | Improvement |
|---|---|---|---|---|
| 2025 | $3,016 | $554,900 | $166,600 | $388,300 |
| 2024 | $3,016 | $557,200 | $160,200 | $397,000 |
| 2023 | $2,975 | $548,100 | $152,200 | $395,900 |
| 2022 | $2,674 | $481,700 | $149,300 | $332,400 |
| 2021 | $2,248 | $344,000 | $116,000 | $228,000 |
| 2020 | $2,180 | $314,800 | $116,000 | $198,800 |
| 2019 | $2,108 | $296,500 | $109,500 | $187,000 |
| 2016 | $1,773 | $239,900 | $109,500 | $130,400 |
Source: Public Records
Map
Nearby Homes
- 8373 S 1100 E Unit 39
- 8485 S Harvard Park Dr
- 8136 S Cottonwood Hills Cir
- 991 Merewood Ct
- 8352 S 1330 E
- 8569 Round Stone Cove
- 8569 Round Stone Cove Unit 8
- 8583 S Harvard Park Dr
- 8268 S 865 E
- 8411 S 1475 E
- 1371 Sudbury Ave
- 1430 E 8685 S
- 7899 S 930 E
- 8390 S 745 E
- 744 E 8425 S
- 1627 E Mulberry Way
- 760 E 8080 S
- 8492 S Mesa Dr
- 7755 S 1130 E
- 8935 Quarry Stone Way
- 8331 Grambling Way
- 8342 Wayside Dr
- 8355 Grambling Way
- 8355 S Grambling Way
- 8330 Wayside Dr
- 8323 Grambling Way
- 8313 Grambling Way
- 8323 S Grambling Way
- 8330 S 1170 E
- 8356 Wayside Dr
- 8367 Grambling Way
- 8316 Wayside Dr
- 8368 Wayside Dr
- 8368 S Wayside Dr
- 8338 Grambling Way
- 8350 Grambling Way
- 8379 S Grambling Way
- 8379 Grambling Way
- 8308 S Wayside Dr
- 8328 Grambling Way
Your Personal Tour Guide
Ask me questions while you tour the home.