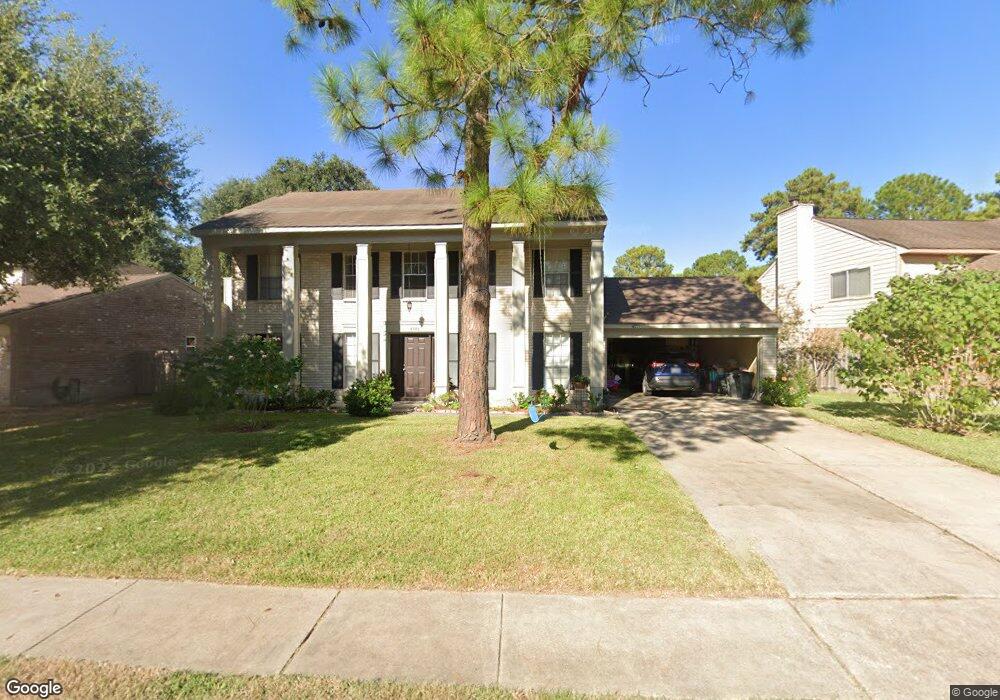
8343 Maple Acres Dr Houston, TX 77095
Copperfield NeighborhoodEstimated Value: $292,971 - $310,000
3
Beds
3
Baths
2,166
Sq Ft
$139/Sq Ft
Est. Value
About This Home
This home is located at 8343 Maple Acres Dr, Houston, TX 77095 and is currently estimated at $300,743, approximately $138 per square foot. 8343 Maple Acres Dr is a home located in Harris County with nearby schools including Fiest Elementary School, Labay Middle School, and Cypress Falls High School.
Ownership History
Date
Name
Owned For
Owner Type
Purchase Details
Closed on
Oct 7, 2013
Sold by
Dao Linh
Bought by
Estrada Mario A
Current Estimated Value
Purchase Details
Closed on
Jul 11, 2007
Sold by
Hud
Bought by
Dao Linh
Purchase Details
Closed on
Oct 12, 2006
Sold by
Netbank
Bought by
Hud
Purchase Details
Closed on
Oct 3, 2006
Sold by
Scranton Chris and Scranton Marlo
Bought by
Netbank
Purchase Details
Closed on
May 6, 2003
Sold by
Soares Sheryl
Bought by
Scranton Marlo and Scranton Chris
Home Financials for this Owner
Home Financials are based on the most recent Mortgage that was taken out on this home.
Original Mortgage
$121,001
Interest Rate
5.87%
Mortgage Type
FHA
Purchase Details
Closed on
Jul 15, 1999
Sold by
Chuellar Mauro and Cuellar Leticia V
Bought by
Soares Sherryl
Home Financials for this Owner
Home Financials are based on the most recent Mortgage that was taken out on this home.
Original Mortgage
$68,600
Interest Rate
7.71%
Create a Home Valuation Report for This Property
The Home Valuation Report is an in-depth analysis detailing your home's value as well as a comparison with similar homes in the area
Home Values in the Area
Average Home Value in this Area
Purchase History
| Date | Buyer | Sale Price | Title Company |
|---|---|---|---|
| Estrada Mario A | -- | None Available | |
| Dao Linh | -- | None Available | |
| Hud | -- | None Available | |
| Netbank | $138,466 | None Available | |
| Scranton Marlo | -- | First American Title | |
| Soares Sherryl | -- | Fidelity National Title |
Source: Public Records
Mortgage History
| Date | Status | Borrower | Loan Amount |
|---|---|---|---|
| Previous Owner | Scranton Marlo | $121,001 | |
| Previous Owner | Soares Sherryl | $68,600 |
Source: Public Records
Tax History Compared to Growth
Tax History
| Year | Tax Paid | Tax Assessment Tax Assessment Total Assessment is a certain percentage of the fair market value that is determined by local assessors to be the total taxable value of land and additions on the property. | Land | Improvement |
|---|---|---|---|---|
| 2025 | $5,496 | $276,590 | $73,131 | $203,459 |
| 2024 | $5,496 | $269,394 | $65,359 | $204,035 |
| 2023 | $5,496 | $284,066 | $65,359 | $218,707 |
| 2022 | $5,818 | $264,014 | $50,167 | $213,847 |
| 2021 | $4,951 | $213,249 | $50,167 | $163,082 |
| 2020 | $4,879 | $204,577 | $41,688 | $162,889 |
| 2019 | $4,784 | $193,847 | $32,856 | $160,991 |
| 2018 | $2,524 | $175,258 | $32,856 | $142,402 |
| 2017 | $4,020 | $175,258 | $32,856 | $142,402 |
| 2016 | $4,020 | $175,258 | $32,856 | $142,402 |
| 2015 | $2,317 | $169,221 | $32,856 | $136,365 |
| 2014 | $2,317 | $144,888 | $27,557 | $117,331 |
Source: Public Records
Map
Nearby Homes
- 8526 Hot Springs Dr
- 15918 Pinyon Creek Dr
- 8306 Lake Crystal Dr
- 15954 Oak Mountain Dr
- 8426 Laurel Trails Dr
- 8550 Sparkling Springs Dr
- 8203 Green Devon Dr
- 16026 Autumn Falls Ln
- 8550 Waiting Spring Ln
- 16215 Wemyss Bay Rd
- 16114 Kintyre Point Rd
- 16215 Cairngorm Ave
- 8526 Greenleaf Lake Dr
- 16335 Drystone Ln
- 15854 Knolls Lodge Dr
- 16111 Aberdeen Forest Dr
- 16123 Aberdeen Forest Dr
- 16030 Royal Garden Dr
- 8818 Apple Mill Dr
- 15735 Jamie Lee Dr
- 8339 Maple Acres Dr
- 8347 Maple Acres Dr
- 51.36 Acres Cr 1690
- 8330 Lime Springs Dr
- 8334 Lime Springs Dr
- 8335 Maple Acres Dr
- 16010 Maple Acres Ct
- 8326 Lime Springs Dr
- 8535 Hot Springs Dr
- 8535 Hot Springs
- 8326 Lime Springs Dr
- 8331 Maple Acres Dr
- 8322 Lime Springs Dr
- 8610 Hot Springs Dr
- 16006 Maple Acres Ct
- 8614 Hot Springs Dr
- 8527 Hot Springs Dr
- 16011 Maple Acres Ct
- 8618 Hot Springs Dr
- 8602 Hot Springs Dr