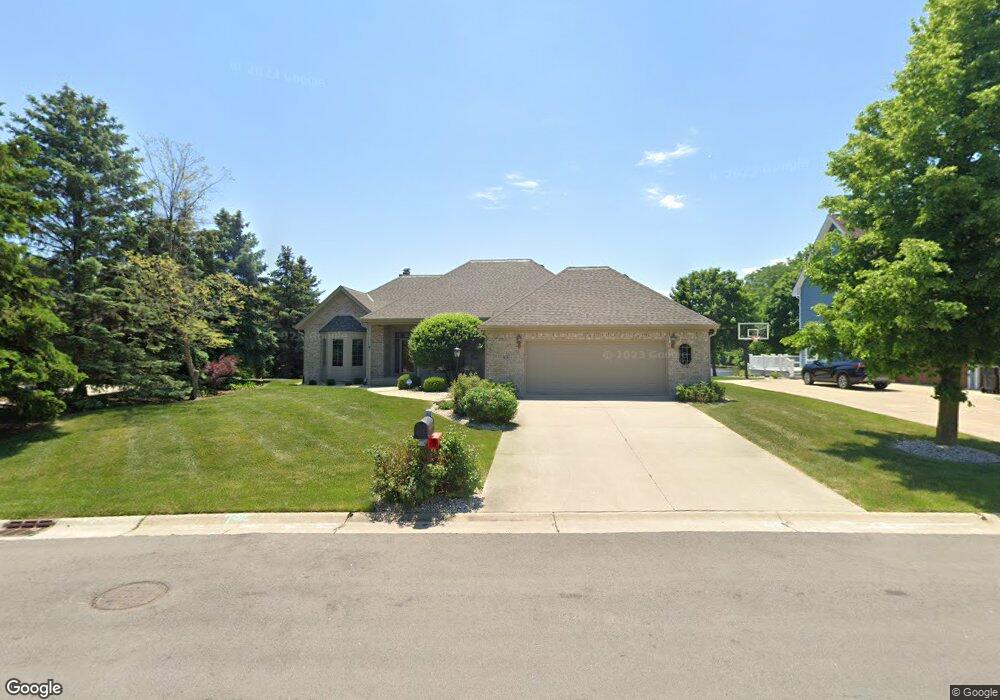
8345 Dora Ln Mount Pleasant, WI 53406
Estimated Value: $498,000 - $608,000
2
Beds
2
Baths
1,983
Sq Ft
$272/Sq Ft
Est. Value
About This Home
This home is located at 8345 Dora Ln, Mount Pleasant, WI 53406 and is currently estimated at $539,470, approximately $272 per square foot. 8345 Dora Ln is a home located in Racine County with nearby schools including Gifford Elementary School, Case High School, and Concordia Lutheran School.
Ownership History
Date
Name
Owned For
Owner Type
Purchase Details
Closed on
Jun 23, 2010
Sold by
Hillman Carol A
Bought by
Diaz Adrian I and Ramirez Adriana
Current Estimated Value
Home Financials for this Owner
Home Financials are based on the most recent Mortgage that was taken out on this home.
Original Mortgage
$270,400
Outstanding Balance
$177,003
Interest Rate
4.97%
Mortgage Type
New Conventional
Estimated Equity
$362,467
Purchase Details
Closed on
Feb 15, 2009
Sold by
Hillman Randal S
Bought by
Hillman Carol A
Home Financials for this Owner
Home Financials are based on the most recent Mortgage that was taken out on this home.
Original Mortgage
$220,800
Interest Rate
5.09%
Mortgage Type
New Conventional
Purchase Details
Closed on
Sep 26, 2008
Sold by
Hillman Randal S and Hillman Carol A
Bought by
Hillman Randal S and Hillman Carol A
Create a Home Valuation Report for This Property
The Home Valuation Report is an in-depth analysis detailing your home's value as well as a comparison with similar homes in the area
Home Values in the Area
Average Home Value in this Area
Purchase History
| Date | Buyer | Sale Price | Title Company |
|---|---|---|---|
| Diaz Adrian I | $338,000 | Land Mark Title Of Racine | |
| Hillman Carol A | -- | None Available | |
| Hillman Randal S | -- | None Available |
Source: Public Records
Mortgage History
| Date | Status | Borrower | Loan Amount |
|---|---|---|---|
| Open | Diaz Adrian I | $270,400 | |
| Previous Owner | Hillman Carol A | $220,800 |
Source: Public Records
Tax History
| Year | Tax Paid | Tax Assessment Tax Assessment Total Assessment is a certain percentage of the fair market value that is determined by local assessors to be the total taxable value of land and additions on the property. | Land | Improvement |
|---|---|---|---|---|
| 2025 | -- | $509,800 | $69,800 | $440,000 |
| 2024 | -- | $476,400 | $69,800 | $406,600 |
| 2023 | $7,246 | $448,300 | $65,100 | $383,200 |
| 2022 | $7,747 | $473,300 | $65,100 | $408,200 |
| 2021 | $6,522 | $357,100 | $59,200 | $297,900 |
| 2020 | $6,868 | $363,200 | $45,500 | $317,700 |
| 2019 | $6,562 | $363,200 | $45,500 | $317,700 |
| 2018 | $6,371 | $327,500 | $42,300 | $285,200 |
| 2017 | $6,038 | $305,700 | $42,300 | $263,400 |
| 2016 | $6,103 | $291,300 | $31,700 | $259,600 |
| 2015 | $6,063 | $291,300 | $31,700 | $259,600 |
| 2014 | $5,725 | $291,300 | $31,700 | $259,600 |
| 2013 | -- | $291,300 | $31,700 | $259,600 |
Source: Public Records
Map
Nearby Homes
- Lt122 Gwendowlyns Walk
- Lt123 Gwendolyns Walk
- 8902 Shadowood Trail
- 1344 Timmie Dr
- 8724 Shady Oak Trail
- 2402 Hoods Creek Path
- 9105 Gittings Rd
- Lt130 Hoods Creek Path
- Lt131 Hoods Creek Path
- Lt108 Hoods Creek Path
- Lt129 Hoods Creek Path
- Lt114 Hoods Creek Path
- Lt118 Hoods Creek Path
- Lt0 Old Spring St
- Lt3 N Stuart Rd
- 8388 Creek View Ln
- 1138 Tall Oak Ct
- 119 S Stuart Rd
- 5202 County Highway H
- 401 90th St
Your Personal Tour Guide
Ask me questions while you tour the home.