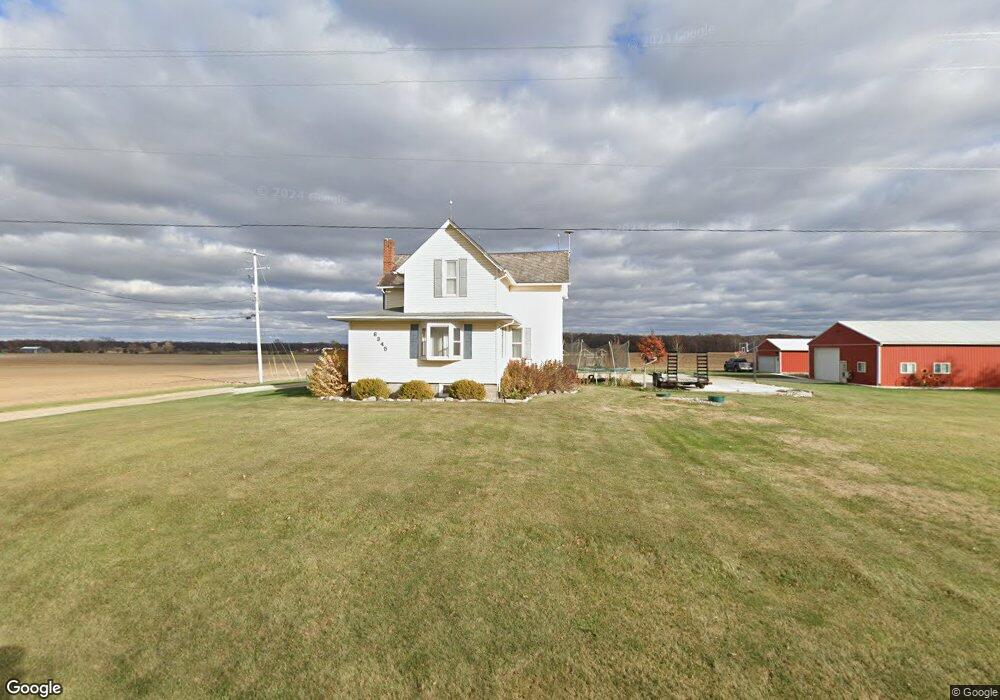
8345 Grange Rd Westphalia, MI 48894
Estimated Value: $252,000 - $400,000
5
Beds
2
Baths
2,228
Sq Ft
$136/Sq Ft
Est. Value
About This Home
This home is located at 8345 Grange Rd, Westphalia, MI 48894 and is currently estimated at $303,745, approximately $136 per square foot. 8345 Grange Rd is a home located in Clinton County with nearby schools including Pewamo-Westphalia Elementary School, Pewamo-Westphalia Junior/Senior High School, and St Mary's School.
Ownership History
Date
Name
Owned For
Owner Type
Purchase Details
Closed on
Sep 18, 2017
Sold by
Cook Jeffrey S and Cook Dawn A
Bought by
Jeffrey S Cook & Dawn A Cook Trust and Cook Jeffrey S
Current Estimated Value
Purchase Details
Closed on
May 11, 2017
Sold by
Pohl Mary and Johnson Lisa
Bought by
Cook Jeffrey S and Cook Dawn A
Purchase Details
Closed on
May 24, 2012
Sold by
Estate Of Lillian Regina Pohl
Bought by
Cook Jeffrey S and Cook Dawn A
Home Financials for this Owner
Home Financials are based on the most recent Mortgage that was taken out on this home.
Original Mortgage
$104,000
Interest Rate
3.9%
Mortgage Type
New Conventional
Create a Home Valuation Report for This Property
The Home Valuation Report is an in-depth analysis detailing your home's value as well as a comparison with similar homes in the area
Home Values in the Area
Average Home Value in this Area
Purchase History
| Date | Buyer | Sale Price | Title Company |
|---|---|---|---|
| Jeffrey S Cook & Dawn A Cook Trust | -- | Attorney | |
| Cook Jeffrey S | -- | None Available | |
| Cook Jeffrey S | $130,000 | The Closing Office Title Age |
Source: Public Records
Mortgage History
| Date | Status | Borrower | Loan Amount |
|---|---|---|---|
| Previous Owner | Cook Jeffrey S | $104,000 |
Source: Public Records
Tax History Compared to Growth
Tax History
| Year | Tax Paid | Tax Assessment Tax Assessment Total Assessment is a certain percentage of the fair market value that is determined by local assessors to be the total taxable value of land and additions on the property. | Land | Improvement |
|---|---|---|---|---|
| 2025 | $2,085 | $120,900 | $26,100 | $94,800 |
| 2024 | $886 | $111,000 | $33,000 | $78,000 |
| 2023 | $839 | $97,200 | $0 | $0 |
| 2022 | $1,565 | $83,200 | $27,000 | $56,200 |
| 2021 | $1,507 | $73,900 | $22,300 | $51,600 |
| 2020 | $1,358 | $66,500 | $19,300 | $47,200 |
| 2019 | $756 | $60,500 | $15,500 | $45,000 |
| 2018 | $1,359 | $55,100 | $14,200 | $40,900 |
| 2017 | -- | $57,700 | $15,200 | $42,500 |
| 2016 | -- | $56,200 | $14,300 | $41,900 |
| 2015 | -- | $53,300 | $0 | $0 |
| 2011 | -- | $54,500 | $0 | $0 |
Source: Public Records
Map
Nearby Homes
- 15340 Cutler Rd
- 0 Mountainmint Cir Unit 287877
- 0 Chicory Ln Unit 286267
- 0 W Herbison Rd
- 9383 Shimano Dr
- 9296 Shimano Dr
- 9237 Shimano Dr
- 13433 S Grange Rd
- 11877 W Herbison Rd
- 11471 S Bauer Rd
- 3926 Divine Hwy
- 11781 W Herbison Rd
- 14507 McCrumb Rd
- 447 Divine Hwy
- 347 Looking Glass Ave
- 13748 Alaska Ave
- 112 S Grant St
- 11744 E Grand River Ave
- 11678 E Grand River Ave
- 8555 W Pratt Rd
- 8338 S Grange Rd
- 8565 S Grange Rd
- 13889 W Pratt Rd
- 13777 Pratt Rd
- 8820 S Grange Rd
- 14407 W Pratt Rd
- 7662 S Grange Rd
- 13377 W Pratt Rd
- 14184 W Lehman Rd
- 14595 W Pratt Rd
- 13755 Lehman Rd
- 7655 Grange Rd
- 13480 W Lehman Rd
- 9123 Grange Rd
- 14253 Lehman Rd
- 13555 W Lehman Rd
- 14297 Lehman Rd
- 13298 Pratt Rd
- 7545 S Grange Rd
- 14650 W Pratt Rd