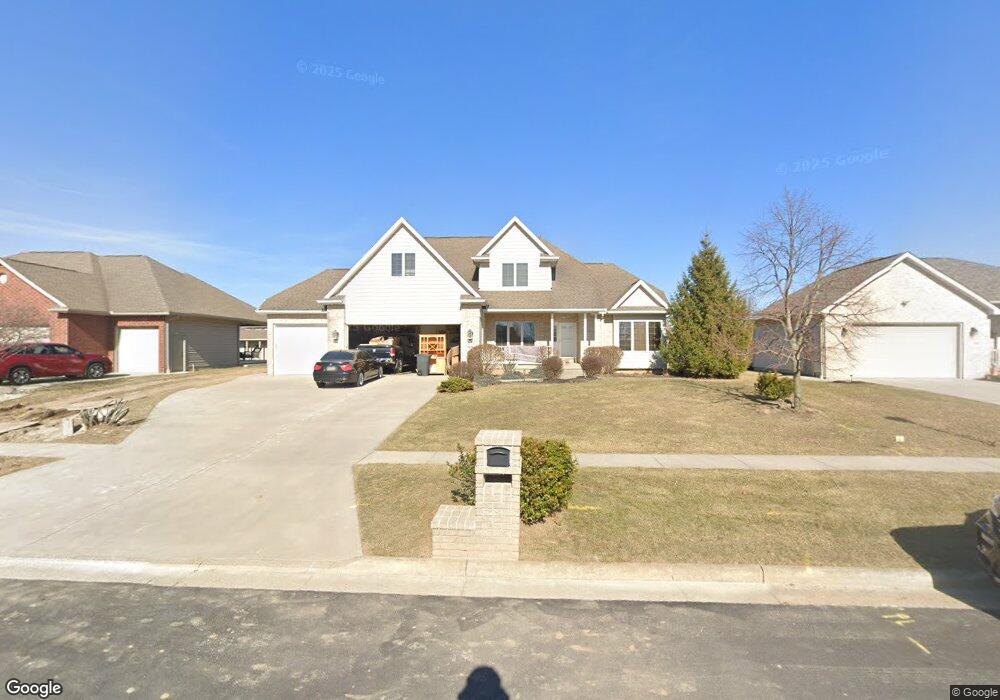
8345 Shawnee Forest Dr Findlay, OH 45840
Estimated Value: $443,000 - $513,000
5
Beds
4
Baths
2,433
Sq Ft
$200/Sq Ft
Est. Value
About This Home
This home is located at 8345 Shawnee Forest Dr, Findlay, OH 45840 and is currently estimated at $487,246, approximately $200 per square foot. 8345 Shawnee Forest Dr is a home located in Hancock County with nearby schools including Wilson Vance Elementary School, Whittier Elementary School, and Glenwood Middle School.
Ownership History
Date
Name
Owned For
Owner Type
Purchase Details
Closed on
Dec 16, 2009
Sold by
Schumacher Ulrich
Bought by
Bell Michael L and Bell Joan M
Current Estimated Value
Home Financials for this Owner
Home Financials are based on the most recent Mortgage that was taken out on this home.
Original Mortgage
$165,000
Outstanding Balance
$107,622
Interest Rate
4.9%
Mortgage Type
New Conventional
Estimated Equity
$379,624
Purchase Details
Closed on
Nov 30, 2004
Sold by
Macke Stanley L
Bought by
Schumacher Ulrich
Home Financials for this Owner
Home Financials are based on the most recent Mortgage that was taken out on this home.
Original Mortgage
$240,000
Interest Rate
5.37%
Mortgage Type
Purchase Money Mortgage
Purchase Details
Closed on
Mar 16, 2004
Sold by
Weinko Inc
Bought by
Macke Stanley L
Create a Home Valuation Report for This Property
The Home Valuation Report is an in-depth analysis detailing your home's value as well as a comparison with similar homes in the area
Home Values in the Area
Average Home Value in this Area
Purchase History
| Date | Buyer | Sale Price | Title Company |
|---|---|---|---|
| Bell Michael L | $282,500 | Hancock Title Agency | |
| Schumacher Ulrich | $300,000 | Mid Am Title Agency | |
| Macke Stanley L | $41,900 | Abstract Title |
Source: Public Records
Mortgage History
| Date | Status | Borrower | Loan Amount |
|---|---|---|---|
| Open | Bell Michael L | $165,000 | |
| Previous Owner | Schumacher Ulrich | $240,000 |
Source: Public Records
Tax History Compared to Growth
Tax History
| Year | Tax Paid | Tax Assessment Tax Assessment Total Assessment is a certain percentage of the fair market value that is determined by local assessors to be the total taxable value of land and additions on the property. | Land | Improvement |
|---|---|---|---|---|
| 2024 | $5,030 | $141,070 | $25,410 | $115,660 |
| 2023 | $5,037 | $141,070 | $25,410 | $115,660 |
| 2022 | $5,020 | $141,070 | $25,410 | $115,660 |
| 2021 | $5,310 | $129,640 | $14,530 | $115,110 |
| 2020 | $5,309 | $129,640 | $14,530 | $115,110 |
| 2019 | $5,203 | $129,640 | $14,530 | $115,110 |
| 2018 | $4,927 | $112,360 | $12,110 | $100,250 |
| 2017 | $4,927 | $112,360 | $12,110 | $100,250 |
| 2016 | $4,673 | $108,630 | $12,110 | $96,520 |
| 2015 | $4,556 | $103,270 | $12,760 | $90,510 |
| 2014 | $4,309 | $99,930 | $12,760 | $87,170 |
| 2012 | $4,337 | $99,930 | $12,760 | $87,170 |
Source: Public Records
Map
Nearby Homes
- 16169 Forest Ln
- 8478 Indian Lake Dr
- 8405 Indian Lake Dr
- 8457 Lakewood Dr
- 0 Hickory Ln Unit 6133896
- 0 Hickory Ln Unit 1 307878
- 0 Hickory Ln Unit 20252999
- 15901 State Route 568
- 8419 E Woodland Trail
- 7507 Township Road 212
- 0 E Us Route 224
- 267 Sierra Ct
- 15329 E Us Route 224
- 7712 E Watermark Dr
- 665 Meadowview Dr
- 0 Meadowview Dr
- 456 Strathaven Dr
- 15711 Mahogany Trail
- 207 Wellington Place
- 15680 Thornwood Dr
- 8361 Shawnee Forest Dr
- 8331 Shawnee Forest Dr
- 8317 Shawnee Forest Dr
- 8377 Shawnee Forest Dr
- 16187 Forest Lake Dr
- 16211 Forest Lake Dr
- 16179 Forest Lake Dr
- 8332 Shawnee Forest Dr
- 8301 Shawnee Forest Dr
- 16221 Forest Lake Dr
- 8379 Plumwood Dr
- 8397 Shawnee Forest Dr
- 8318 Shawnee Forest Dr
- 16167 Forest Lake Dr
- 16151 Forest Lake Dr
- 8302 Shawnee Forest Dr
- 16239 Forest Lake Dr
- 8281 Shawnee Forest Dr
- 8387 Plumwood Dr
- 8380 Plumwood Dr