8346 Fuqua Gardens Houston, TX 77075
Greater Hobby Area NeighborhoodEstimated Value: $242,965 - $271,000
4
Beds
3
Baths
1,537
Sq Ft
$167/Sq Ft
Est. Value
About This Home
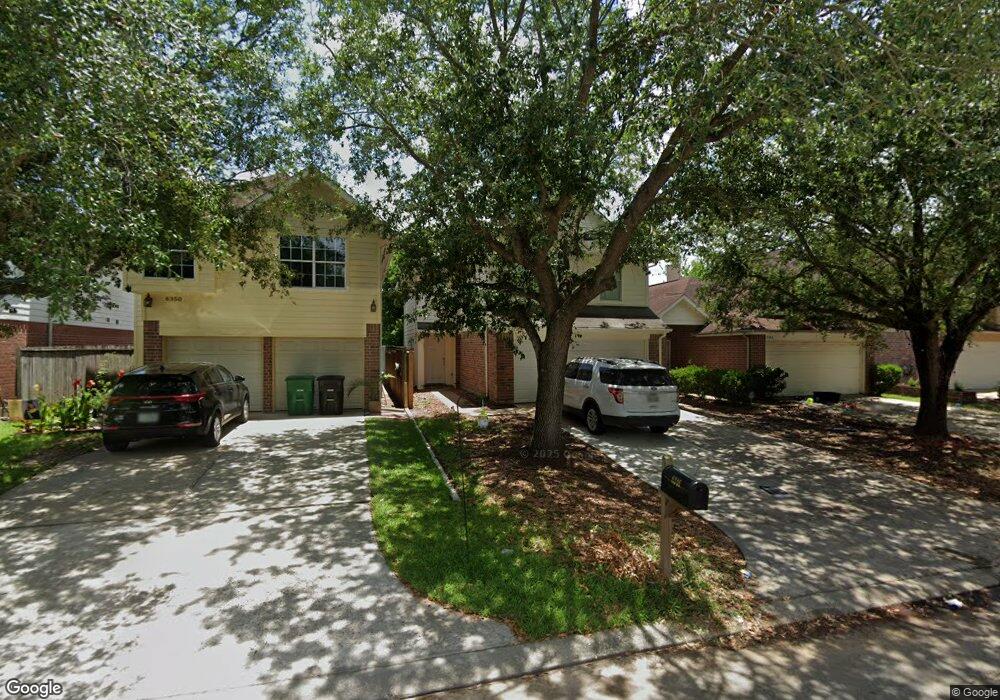
This home is located at 8346 Fuqua Gardens, Houston, TX 77075 and is currently estimated at $256,991, approximately $167 per square foot. 8346 Fuqua Gardens is a home located in Harris County with nearby schools including Mitchell Elementary School, Albert Thomas Middle School, and Ross Shaw Sterling Aviation High School.
Ownership History
Date
Name
Owned For
Owner Type
Purchase Details
Closed on
Apr 19, 2021
Sold by
Mcdonald Janice
Bought by
Yamasa Co Ltd
Current Estimated Value
Purchase Details
Closed on
Jul 10, 2003
Sold by
Williams Jacqueline and Williams Roderick
Bought by
Mcdonald Janice
Home Financials for this Owner
Home Financials are based on the most recent Mortgage that was taken out on this home.
Original Mortgage
$111,900
Interest Rate
5.23%
Mortgage Type
Purchase Money Mortgage
Purchase Details
Closed on
Jun 24, 2002
Sold by
Texas Colonial Homes Lp
Bought by
Clayton Jacqueline and Williams Roderick
Home Financials for this Owner
Home Financials are based on the most recent Mortgage that was taken out on this home.
Original Mortgage
$102,718
Interest Rate
6.89%
Mortgage Type
FHA
Create a Home Valuation Report for This Property
The Home Valuation Report is an in-depth analysis detailing your home's value as well as a comparison with similar homes in the area
Home Values in the Area
Average Home Value in this Area
Purchase History
| Date | Buyer | Sale Price | Title Company |
|---|---|---|---|
| Yamasa Co Ltd | -- | None Listed On Document | |
| Mcdonald Janice | -- | Stewart Title Company | |
| Clayton Jacqueline | -- | Stewart Title | |
| Texas Colonial Homes Lp | -- | Stewart Title |
Source: Public Records
Mortgage History
| Date | Status | Borrower | Loan Amount |
|---|---|---|---|
| Previous Owner | Mcdonald Janice | $111,900 | |
| Previous Owner | Clayton Jacqueline | $102,718 |
Source: Public Records
Tax History Compared to Growth
Tax History
| Year | Tax Paid | Tax Assessment Tax Assessment Total Assessment is a certain percentage of the fair market value that is determined by local assessors to be the total taxable value of land and additions on the property. | Land | Improvement |
|---|---|---|---|---|
| 2025 | $4,502 | $195,865 | $45,630 | $150,235 |
| 2024 | $4,502 | $215,176 | $45,630 | $169,546 |
| 2023 | $4,502 | $204,625 | $45,630 | $158,995 |
| 2022 | $4,732 | $214,915 | $45,630 | $169,285 |
| 2021 | $3,634 | $155,939 | $35,100 | $120,839 |
| 2020 | $3,776 | $155,939 | $35,100 | $120,839 |
| 2019 | $3,946 | $155,939 | $35,100 | $120,839 |
| 2018 | $3,170 | $125,260 | $28,431 | $96,829 |
| 2017 | $3,167 | $125,260 | $28,431 | $96,829 |
| 2016 | $3,167 | $125,260 | $28,431 | $96,829 |
| 2015 | $3,004 | $115,311 | $28,431 | $86,880 |
| 2014 | $3,004 | $116,859 | $15,795 | $101,064 |
Source: Public Records
Map
Nearby Homes
- 8420 Fuqua St
- TBD Arrowhead Ln
- 10806 Tallow Briar
- 8612 Fuqua St
- 8405 Folkstone Ln
- 8417 Folkstone Ln
- 001 Fuqua St
- 8412 Peekskill Ln
- 8410 Saylynn Ln
- 8718 Black Cliff Ln
- 7851 Fuqua St
- 8615 Tartan Walk Ln
- 0 Leitz Rd
- 10815 Leitz Rd
- 8614 Viera Ln
- 8428 Swiftwater Ln
- 10218 Carmencita Way
- 10405 Gulf Meadows Dr
- 11222 Hall Meadows Ct
- 8706 Danbury Hollow Ln
- 8346 Fuqua Gardens Dr
- 8342 Fuqua Gardens Dr
- 8350 Fuqua Gardens
- 8342 Fuqua Gardens
- 8342 Fuqua Gardens Unit DR
- 8338 Fuqua Gardens Dr
- 8354 Fuqua Gardens
- 8338 Fuqua Gardens
- 8334 Fuqua Gardens Dr
- 8358 Fuqua Gardens
- 8334 Fuqua Gardens
- 8339 Fuqua Gd
- 8330 Fuqua Gardens Dr
- 8362 Fuqua Gardens
- 8330 Fuqua Gardens
- 8362 Fuqua Gardens Dr
- 8366 Fuqua Gardens
- 8326 Fuqua Gardens
- 8347 Fuqua Gardens
- 8351 Fuqua Gardens