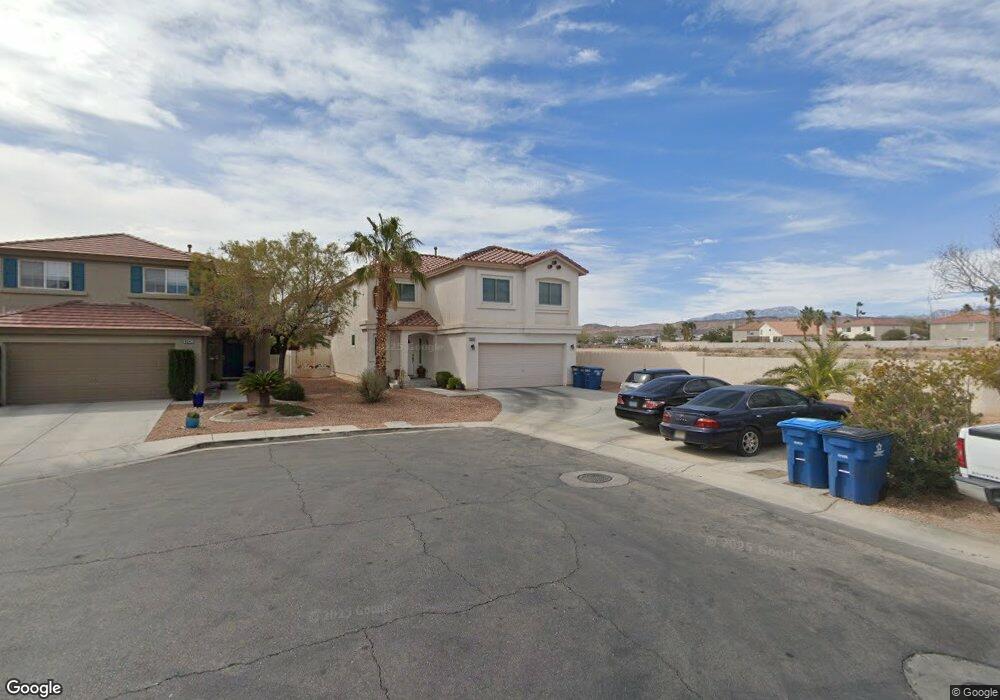
8347 Hipwader Ct Unit II Las Vegas, NV 89113
Estimated Value: $455,000 - $487,634
4
Beds
3
Baths
1,807
Sq Ft
$260/Sq Ft
Est. Value
About This Home
This home is located at 8347 Hipwader Ct Unit II, Las Vegas, NV 89113 and is currently estimated at $470,659, approximately $260 per square foot. 8347 Hipwader Ct Unit II is a home located in Clark County with nearby schools including Lucille S. Rogers Elementary School, Grant Sawyer Middle School, and Durango High School.
Ownership History
Date
Name
Owned For
Owner Type
Purchase Details
Closed on
Apr 13, 2024
Sold by
Salavante Aurora Andrea Rivera
Bought by
Aurora Andrea Rivera Salavante Revocable Trus and Salavante
Current Estimated Value
Home Financials for this Owner
Home Financials are based on the most recent Mortgage that was taken out on this home.
Original Mortgage
$74,600
Outstanding Balance
$71,972
Interest Rate
6.74%
Mortgage Type
New Conventional
Estimated Equity
$398,687
Purchase Details
Closed on
May 27, 2022
Sold by
Salavante Aurora R
Bought by
Aurora Andrea Rivera Salvante Revocable Trust
Purchase Details
Closed on
May 22, 2001
Sold by
American West Homes Inc
Bought by
Salavante George B and Salavante Aurora R
Home Financials for this Owner
Home Financials are based on the most recent Mortgage that was taken out on this home.
Original Mortgage
$145,750
Interest Rate
7.06%
Create a Home Valuation Report for This Property
The Home Valuation Report is an in-depth analysis detailing your home's value as well as a comparison with similar homes in the area
Home Values in the Area
Average Home Value in this Area
Purchase History
| Date | Buyer | Sale Price | Title Company |
|---|---|---|---|
| Aurora Andrea Rivera Salavante Revocable Trus | -- | Amrock | |
| Salavante Aurora | -- | Amrock | |
| Aurora Andrea Rivera Salvante Revocable Trust | -- | None Listed On Document | |
| Salavante George B | $153,450 | First American Title Co |
Source: Public Records
Mortgage History
| Date | Status | Borrower | Loan Amount |
|---|---|---|---|
| Open | Salavante Aurora | $74,600 | |
| Previous Owner | Salavante George B | $145,750 |
Source: Public Records
Tax History Compared to Growth
Tax History
| Year | Tax Paid | Tax Assessment Tax Assessment Total Assessment is a certain percentage of the fair market value that is determined by local assessors to be the total taxable value of land and additions on the property. | Land | Improvement |
|---|---|---|---|---|
| 2025 | $2,160 | $115,219 | $45,500 | $69,719 |
| 2024 | $2,001 | $115,219 | $45,500 | $69,719 |
| 2023 | $2,001 | $106,397 | $40,600 | $65,797 |
| 2022 | $1,853 | $89,978 | $29,750 | $60,228 |
| 2021 | $1,716 | $86,594 | $29,400 | $57,194 |
| 2020 | $1,590 | $83,608 | $26,950 | $56,658 |
| 2019 | $1,491 | $78,915 | $23,100 | $55,815 |
| 2018 | $1,422 | $73,432 | $19,950 | $53,482 |
| 2017 | $2,123 | $72,388 | $18,200 | $54,188 |
| 2016 | $1,332 | $67,054 | $14,000 | $53,054 |
| 2015 | $1,329 | $52,132 | $10,500 | $41,632 |
| 2014 | $1,290 | $42,672 | $7,700 | $34,972 |
Source: Public Records
Map
Nearby Homes
- Kaufman Plan at Tenaya Springs
- Avondale Plan at Tenaya Springs
- Lovell Plan at Tenaya Springs
- 8162 Seminario Ave
- 6161 Andover Wood Rd
- 6233 Canterbury Field Rd
- 6160 Rumrill St Unit 118
- 8023 Villa Trovas Ct
- 5835 Rainbow Trout Ct
- 6128 Stetson Cove Ct
- 6168 Stetson Cove Ct
- 8555 W Russell Rd Unit 1026
- 7927 W Oquendo Rd
- 5766 Whimsical St
- 6369 Staley Downs St
- 5762 Whimsical St
- 7894 W Patrick Ln
- 5758 Whimsical St
- 5754 Whimsical St
- 8089 Muir Brook Ave
- 8341 Hipwader Ct
- 8335 Hipwader Ct
- 8348 Polar Shrimp Ct
- 8340 Polar Shrimp Ct
- 8329 Hipwader Ct
- 8346 Hipwader Ct
- 8332 Polar Shrimp Ct
- 8338 Hipwader Ct
- 8323 Hipwader Ct
- 8330 Hipwader Ct
- 8324 Polar Shrimp Ct
- 8322 Hipwader Ct
- 8317 Hipwader Ct
- 8316 Polar Shrimp Ct
- 8343 Feather Duster Ct
- 8314 Hipwader Ct
- 8335 Feather Duster Ct
- 8349 Polar Shrimp Ct
- 8311 Hipwader Ct
- 8327 Feather Duster Ct