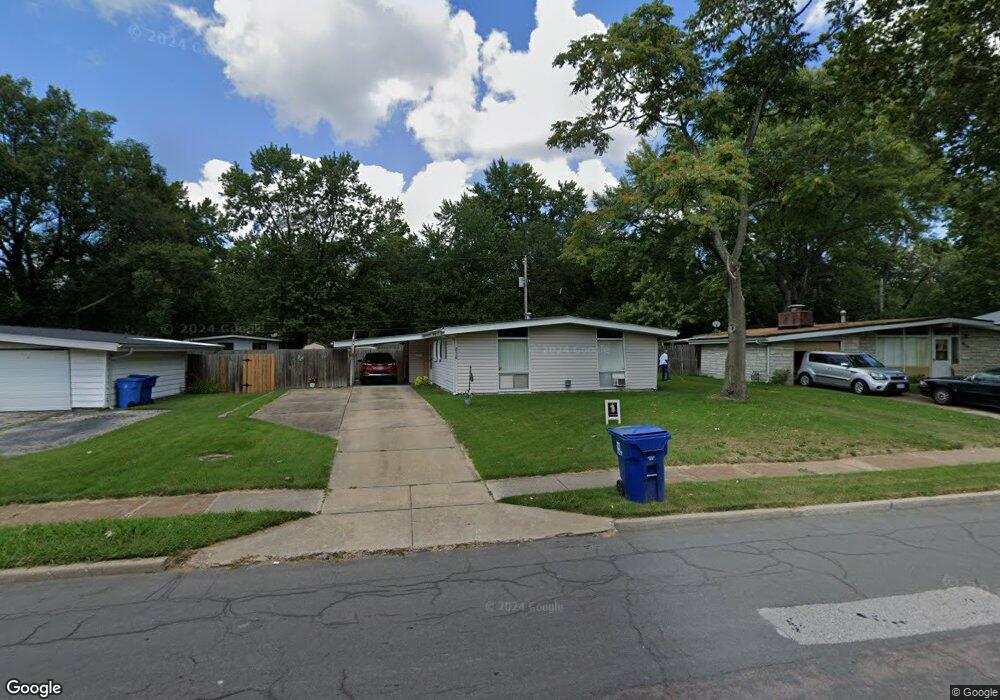
835 Derhake Rd Florissant, MO 63033
Estimated Value: $106,000 - $164,000
3
Beds
1
Bath
1,107
Sq Ft
$125/Sq Ft
Est. Value
About This Home
This home is located at 835 Derhake Rd, Florissant, MO 63033 and is currently estimated at $137,887, approximately $124 per square foot. 835 Derhake Rd is a home located in St. Louis County with nearby schools including Robinwood Elementary School, Cross Keys Middle School, and McCluer North High School.
Ownership History
Date
Name
Owned For
Owner Type
Purchase Details
Closed on
May 23, 2013
Sold by
Jahnke Barbara Behlmann
Bought by
Behlmann Barbara A
Current Estimated Value
Home Financials for this Owner
Home Financials are based on the most recent Mortgage that was taken out on this home.
Original Mortgage
$45,465
Outstanding Balance
$32,144
Interest Rate
3.43%
Mortgage Type
New Conventional
Estimated Equity
$105,743
Purchase Details
Closed on
Apr 2, 2002
Sold by
Jahnke Barbara Behlmann and Behlmann Herbert J
Bought by
Jahnke Barbara Behlmann
Purchase Details
Closed on
Nov 15, 2001
Sold by
Leadford Ronald J and Leadford Kim M
Bought by
City Of St Louis
Purchase Details
Closed on
Feb 23, 2001
Sold by
Jahnke Barbara A
Bought by
Behlmann Herbert J and Behlmann Delores B
Purchase Details
Closed on
Feb 15, 1999
Sold by
Jahnke Barbara A
Bought by
Jahnke Barbara Behlmann and Behlmann Herbert J
Create a Home Valuation Report for This Property
The Home Valuation Report is an in-depth analysis detailing your home's value as well as a comparison with similar homes in the area
Home Values in the Area
Average Home Value in this Area
Purchase History
| Date | Buyer | Sale Price | Title Company |
|---|---|---|---|
| Behlmann Barbara A | -- | Servicelink Aliquippa Title | |
| Jahnke Barbara Behlmann | -- | -- | |
| City Of St Louis | -- | Capital Title | |
| Behlmann Herbert J | -- | -- | |
| Jahnke Barbara Behlmann | -- | -- |
Source: Public Records
Mortgage History
| Date | Status | Borrower | Loan Amount |
|---|---|---|---|
| Open | Behlmann Barbara A | $45,465 |
Source: Public Records
Tax History Compared to Growth
Tax History
| Year | Tax Paid | Tax Assessment Tax Assessment Total Assessment is a certain percentage of the fair market value that is determined by local assessors to be the total taxable value of land and additions on the property. | Land | Improvement |
|---|---|---|---|---|
| 2025 | $1,524 | $23,360 | $6,180 | $17,180 |
| 2024 | $1,524 | $19,460 | $4,660 | $14,800 |
| 2023 | $1,518 | $19,460 | $4,660 | $14,800 |
| 2022 | $1,428 | $16,080 | $4,660 | $11,420 |
| 2021 | $1,405 | $16,080 | $4,660 | $11,420 |
| 2020 | $1,201 | $12,960 | $3,570 | $9,390 |
| 2019 | $1,178 | $12,960 | $3,570 | $9,390 |
| 2018 | $975 | $9,540 | $2,050 | $7,490 |
| 2017 | $970 | $9,540 | $2,050 | $7,490 |
| 2016 | $948 | $9,080 | $2,050 | $7,030 |
| 2015 | $954 | $9,080 | $2,050 | $7,030 |
| 2014 | $1,264 | $12,520 | $3,460 | $9,060 |
Source: Public Records
Map
Nearby Homes
- 805 Derhake Rd
- 750 Robinwood Dr
- 785 Bobbins Ln
- 130 Dauphin Ln
- 105 Capri Dr
- 2320 Allen Dr
- 2 Carson Ct
- 190 Coteau Ln
- 12 Country Ln
- 2020 Washington St Unit 707
- 13 Bayberry Ln
- 265 Waterford Dr
- 2240 Brook Dr
- 2340 Saint Catherine St
- 505 Ridge Dr
- 2505 Saint Catherine St
- 14 Saint Martha Ct
- 675 Pimlico Dr
- 13 Saint Thomas Ct
- 1205 Saint Matthew Dr
- 825 Derhake Rd
- 845 Derhake Rd
- 830 Robinwood Dr
- 815 Derhake Rd
- 855 Derhake Rd
- 820 Robinwood Dr
- 840 Robinwood Dr
- 870 Derhake Rd
- 810 Robinwood Dr
- 860 Derhake Rd
- 850 Robinwood Dr
- 865 Derhake Rd
- 800 Robinwood Dr
- 860 Robinwood Dr
- 840 Derhake Rd
- 795 Derhake Rd
- 875 Derhake Rd
- 790 Robinwood Dr
- 880 Robinwood Dr
- 845 Robinwood Dr