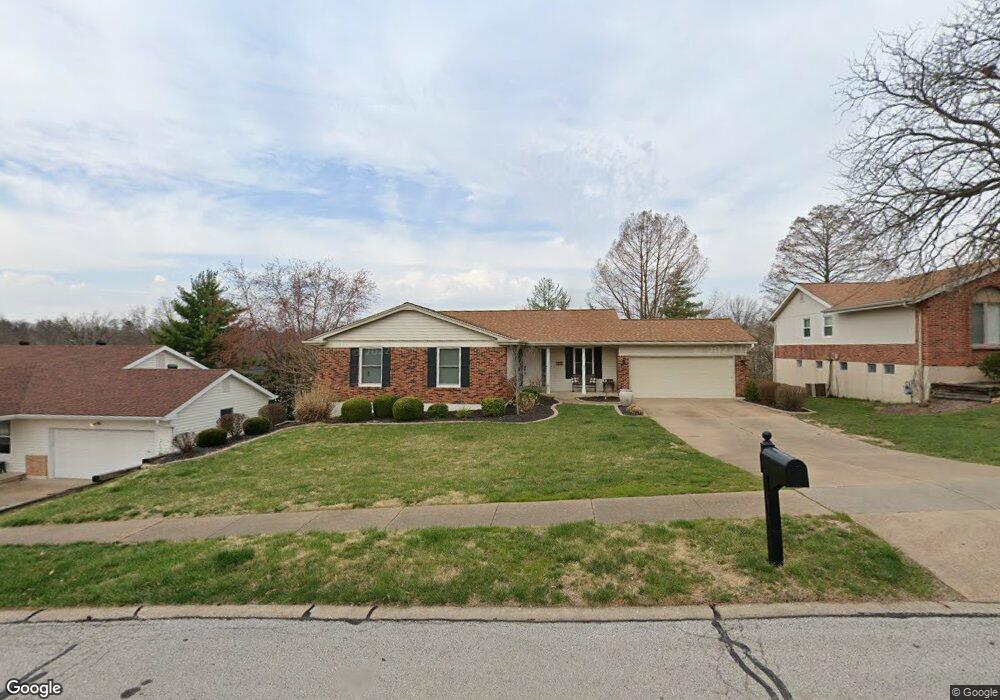
835 Green Lantern Ln Ballwin, MO 63011
Estimated Value: $406,015 - $488,000
4
Beds
2
Baths
2,032
Sq Ft
$222/Sq Ft
Est. Value
About This Home
This home is located at 835 Green Lantern Ln, Ballwin, MO 63011 and is currently estimated at $451,254, approximately $222 per square foot. 835 Green Lantern Ln is a home located in St. Louis County with nearby schools including Henry Elementary School, Parkway West Middle School, and Parkway West High School.
Ownership History
Date
Name
Owned For
Owner Type
Purchase Details
Closed on
Mar 18, 2021
Sold by
Rauch Nicholas William and Rauch Sarah B
Bought by
Rauch Nicholas William and Rauch Sarah B
Current Estimated Value
Home Financials for this Owner
Home Financials are based on the most recent Mortgage that was taken out on this home.
Original Mortgage
$162,000
Outstanding Balance
$120,790
Interest Rate
3%
Mortgage Type
New Conventional
Estimated Equity
$330,464
Purchase Details
Closed on
May 5, 2011
Sold by
Ridgemoor Investments Inc
Bought by
Rauch Nicholas William and Rauch William Paul
Purchase Details
Closed on
Jan 11, 2011
Sold by
Petrie Jane K
Bought by
Ridgemoor Investments Inc
Home Financials for this Owner
Home Financials are based on the most recent Mortgage that was taken out on this home.
Original Mortgage
$132,000
Interest Rate
4.56%
Mortgage Type
Future Advance Clause Open End Mortgage
Create a Home Valuation Report for This Property
The Home Valuation Report is an in-depth analysis detailing your home's value as well as a comparison with similar homes in the area
Home Values in the Area
Average Home Value in this Area
Purchase History
| Date | Buyer | Sale Price | Title Company |
|---|---|---|---|
| Rauch Nicholas William | -- | Investors Title Co Clayton | |
| Rauch Nicholas William | -- | Investors Title | |
| Rauch Nicholas William | $240,000 | None Available | |
| Ridgemoor Investments Inc | $132,000 | Investors Title Company |
Source: Public Records
Mortgage History
| Date | Status | Borrower | Loan Amount |
|---|---|---|---|
| Open | Rauch Nicholas William | $162,000 | |
| Closed | Rauch Nicholas William | $162,000 | |
| Previous Owner | Ridgemoor Investments Inc | $132,000 |
Source: Public Records
Tax History
| Year | Tax Paid | Tax Assessment Tax Assessment Total Assessment is a certain percentage of the fair market value that is determined by local assessors to be the total taxable value of land and additions on the property. | Land | Improvement |
|---|---|---|---|---|
| 2025 | $4,414 | $67,710 | $27,870 | $39,840 |
| 2024 | $4,414 | $67,950 | $26,260 | $41,690 |
| 2023 | $4,414 | $67,950 | $26,260 | $41,690 |
| 2022 | $4,201 | $58,710 | $22,500 | $36,210 |
| 2021 | $4,175 | $58,710 | $22,500 | $36,210 |
| 2020 | $4,070 | $54,700 | $18,730 | $35,970 |
| 2019 | $4,022 | $54,700 | $18,730 | $35,970 |
| 2018 | $3,617 | $45,480 | $16,870 | $28,610 |
| 2017 | $3,576 | $45,480 | $16,870 | $28,610 |
| 2016 | $3,493 | $42,130 | $12,200 | $29,930 |
| 2015 | $3,653 | $42,130 | $12,200 | $29,930 |
| 2014 | $3,140 | $40,370 | $8,680 | $31,690 |
Source: Public Records
Map
Nearby Homes
- 828 Windmill Dr
- 909 Dutch Mill Dr
- 1022 Julianna Dr
- 902 Rusticmanor Cir
- 1042 Parkwatch Dr
- 1061 Summer Tree Dr
- 718 Savannah Crossing Way
- 490 Maymont Dr
- 724 Clayton Corners Dr
- 1007 Devonworth Manor Way
- 1041 Kennedy Ln
- 502 Iron Lantern Dr
- 1388 Wakeshire Terrace
- 14471 Bantry Ln Unit 11
- 14443 Bantry Ln Unit 24
- 449 Brass Lamp Dr
- 609 Auber Dr
- 709 Turtle Cove
- 900 Weidman Rd
- 1004 Weidman Rd
- 833 Green Lantern Ln
- 837 Green Lantern Ln
- 832 Windmill Dr
- 839 Green Lantern Ln
- 832 Gardenway Dr
- 834 Windmill Dr
- 831 Green Lantern Ln
- 836 Green Lantern Ln
- 834 Gardenway Dr
- 838 Green Lantern Ln
- 834 Green Lantern Ln
- 830 Gardenway Dr
- 841 Green Lantern Ln
- 832 Green Lantern Ln
- 840 Green Lantern Ln
- 836 Gardenway Dr
- 830 Green Lantern Ln
- 829 Windmill Dr
- 842 Green Lantern Ln
- 843 Green Lantern Ln
Your Personal Tour Guide
Ask me questions while you tour the home.