R
Landlord's Agent in 2015
RACHEL WINEBRAKE
Coldwell Banker Town & Country Properties
(570) 954-5503
2 in this area
28 Total Sales
Estimated Value: $238,761
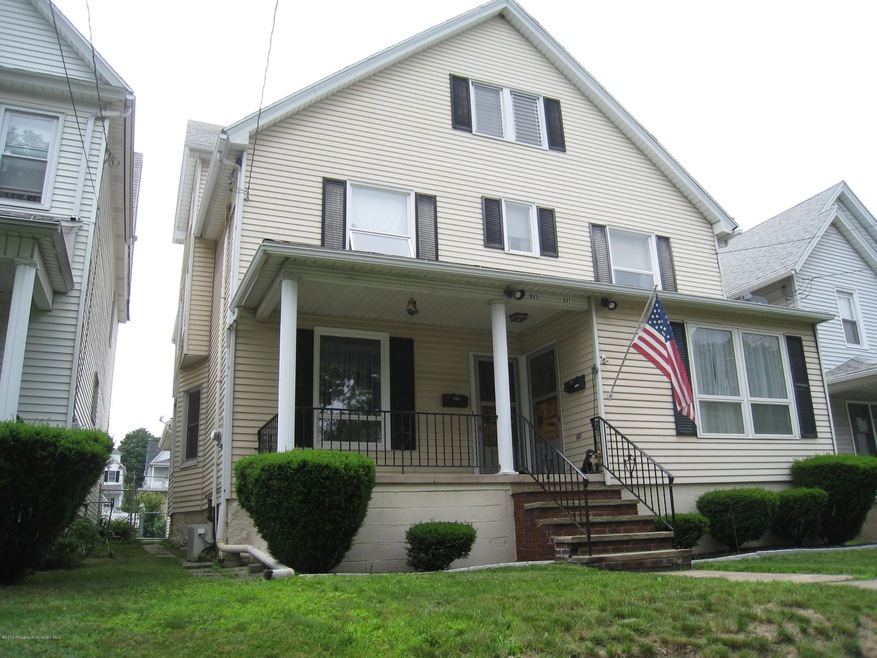
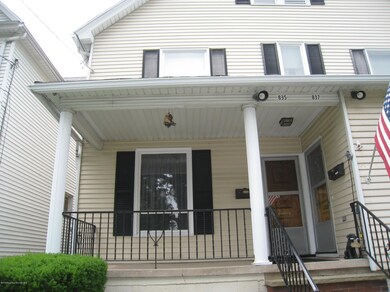
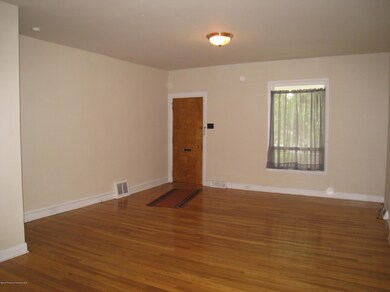
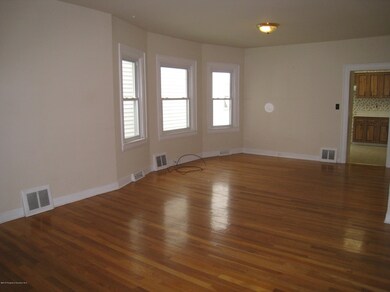
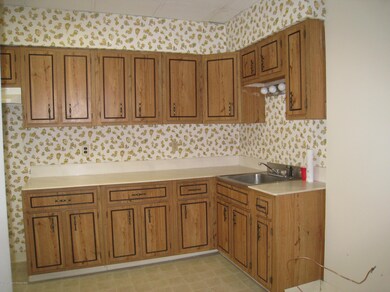
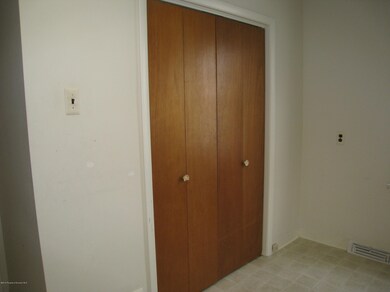
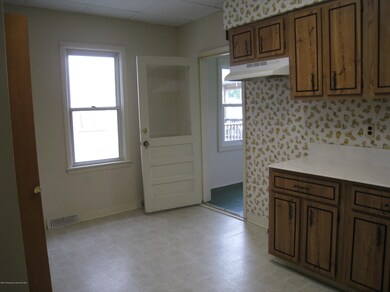
IMMACULATE half-double in great West Scranton area features wide-open living and dining rooms with lovely hardwood floors, kitchen with abundance of cabinetry and large closet, and unheated 11' x 12' bonus room. Two carpeted upper bedrooms with closets and full bath. Covered porch. Insulated windows. Separate utilities. Gas warm-air heat. No pets or smoking permitted. Minimum 1-year lease., Beds: 2+Bed2nd, SqFt Fin - Main: 620.00, SqFt Fin - 3rd: 0.00, Baths: 1 Bath Lev 2, Semi-Modern Kitchen: Y, SqFt Fin - 2nd: 425.00, Ttl Lease Term Mnths: 12, Yearly Lease Value: 8400
Last Agent to Rent the Property
Coldwell Banker Town & Country Properties License #RS168663L Listed on: 06/20/2015

Last Renter's Agent
Coldwell Banker Town & Country Properties License #RS168663L Listed on: 06/20/2015
| Date | Buyer | Sale Price | Title Company |
|---|---|---|---|
| Joyce Patrick C | $117,000 | None Available | |
| Florey Gordon | -- | -- |
| Date | Status | Borrower | Loan Amount |
|---|---|---|---|
| Open | Joyce Patrick C | $114,880 |
| Date | Event | Price | List to Sale | Price per Sq Ft |
|---|---|---|---|---|
| 08/15/2015 08/15/15 | Rented | $8,400 | +1100.0% | -- |
| 07/07/2015 07/07/15 | Under Contract | -- | -- | -- |
| 06/20/2015 06/20/15 | For Rent | $700 | -- | -- |
| Year | Tax Paid | Tax Assessment Tax Assessment Total Assessment is a certain percentage of the fair market value that is determined by local assessors to be the total taxable value of land and additions on the property. | Land | Improvement |
|---|---|---|---|---|
| 2025 | $4,363 | $13,500 | $2,250 | $11,250 |
| 2024 | $3,989 | $13,500 | $2,250 | $11,250 |
| 2023 | $3,989 | $13,500 | $2,250 | $11,250 |
| 2022 | $3,901 | $13,500 | $2,250 | $11,250 |
| 2021 | $3,901 | $13,500 | $2,250 | $11,250 |
| 2020 | $3,829 | $13,500 | $2,250 | $11,250 |
| 2019 | $3,602 | $13,500 | $2,250 | $11,250 |
| 2018 | $3,602 | $13,500 | $2,250 | $11,250 |
| 2017 | $3,538 | $13,500 | $2,250 | $11,250 |
| 2016 | $0 | $13,500 | $2,250 | $11,250 |
| 2015 | $2,658 | $13,500 | $2,250 | $11,250 |
| 2014 | -- | $13,500 | $2,250 | $11,250 |
R
Landlord's Agent in 2015
RACHEL WINEBRAKE
Coldwell Banker Town & Country Properties
(570) 954-5503
2 in this area
28 Total Sales
Source: Greater Scranton Board of REALTORS®
MLS Number: GSB153027
APN: 14507030030
Disclaimer: Certain information contained herein is derived from information provided by parties other than Homes.com. All information provided is deemed reliable, but is not guaranteed to be accurate and should be independently verified.
![]() Information provided by the Greater Scranton Board of REALTORS® MLS. Information is for consumer’s personal noncommercial use, and may not be used for any purpose other than identifying properties which consumers may be interested in purchasing. Consult the specific municipality for permitted Zoning uses.
Information provided by the Greater Scranton Board of REALTORS® MLS. Information is for consumer’s personal noncommercial use, and may not be used for any purpose other than identifying properties which consumers may be interested in purchasing. Consult the specific municipality for permitted Zoning uses.