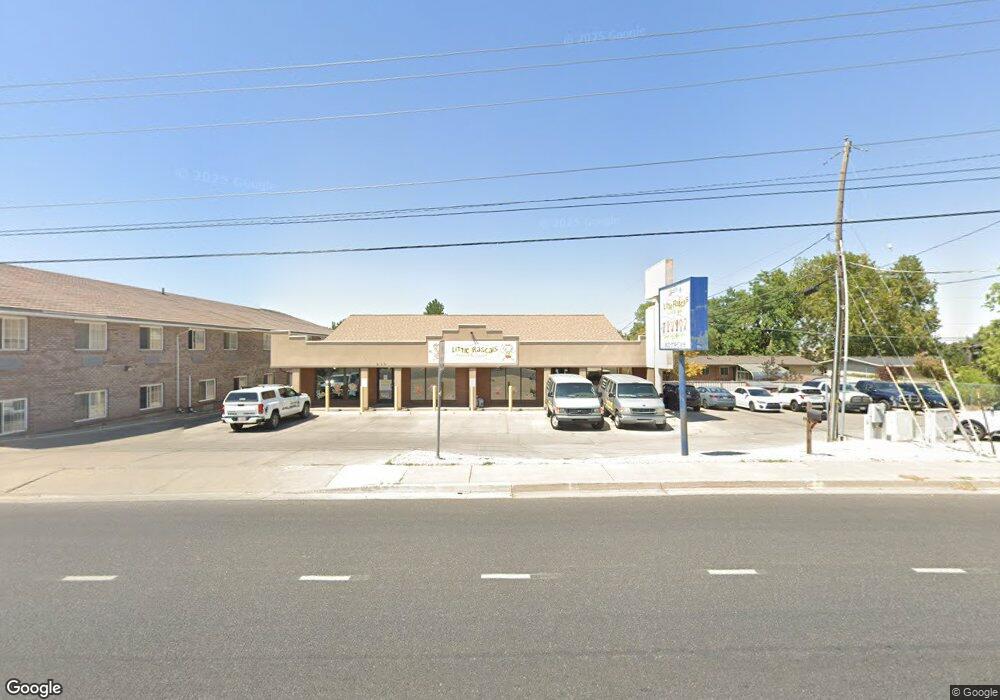
835 N Main St Clearfield, UT 84015
--
Bed
--
Bath
2,000
Sq Ft
0.45
Acres
About This Home
This home is located at 835 N Main St, Clearfield, UT 84015. 835 N Main St is a home located in Davis County with nearby schools including Doxey School, Sunset Junior High School, and Northridge High School.
Ownership History
Date
Name
Owned For
Owner Type
Purchase Details
Closed on
Mar 30, 2005
Sold by
Perkins Michael H and Perkins Gayla B
Bought by
Bradison Investments L L C
Home Financials for this Owner
Home Financials are based on the most recent Mortgage that was taken out on this home.
Original Mortgage
$233,204
Outstanding Balance
$118,932
Interest Rate
5.7%
Mortgage Type
Commercial
Purchase Details
Closed on
Mar 21, 2005
Sold by
Ricketts Michael
Bought by
Ricketts Michael and Ricketts Peggy Lee
Home Financials for this Owner
Home Financials are based on the most recent Mortgage that was taken out on this home.
Original Mortgage
$233,204
Outstanding Balance
$118,932
Interest Rate
5.7%
Mortgage Type
Commercial
Create a Home Valuation Report for This Property
The Home Valuation Report is an in-depth analysis detailing your home's value as well as a comparison with similar homes in the area
Home Values in the Area
Average Home Value in this Area
Purchase History
| Date | Buyer | Sale Price | Title Company |
|---|---|---|---|
| Bradison Investments L L C | -- | None Available | |
| Bradison Investments Llc | -- | None Available | |
| Ricketts Michael | -- | None Available |
Source: Public Records
Mortgage History
| Date | Status | Borrower | Loan Amount |
|---|---|---|---|
| Open | Bradison Investments Llc | $233,204 | |
| Closed | Bradison Investments L L C | $233,204 |
Source: Public Records
Tax History Compared to Growth
Tax History
| Year | Tax Paid | Tax Assessment Tax Assessment Total Assessment is a certain percentage of the fair market value that is determined by local assessors to be the total taxable value of land and additions on the property. | Land | Improvement |
|---|---|---|---|---|
| 2025 | $5,788 | $527,959 | $228,714 | $299,245 |
| 2024 | $5,152 | $258,499 | $93,915 | $164,584 |
| 2023 | $5,247 | $264,000 | $93,915 | $170,084 |
| 2022 | $5,331 | $480,000 | $170,755 | $309,245 |
| 2021 | $1,877 | $451,549 | $129,730 | $321,819 |
| 2020 | $5,618 | $430,000 | $108,181 | $321,819 |
| 2019 | $5,485 | $430,566 | $131,191 | $299,375 |
| 2018 | $5,183 | $398,228 | $118,765 | $279,463 |
| 2016 | $5,267 | $378,100 | $117,600 | $260,500 |
| 2015 | $4,541 | $308,900 | $117,600 | $191,300 |
| 2014 | $4,444 | $308,900 | $117,600 | $191,300 |
| 2013 | -- | $302,800 | $117,600 | $185,200 |
Source: Public Records
Map
Nearby Homes