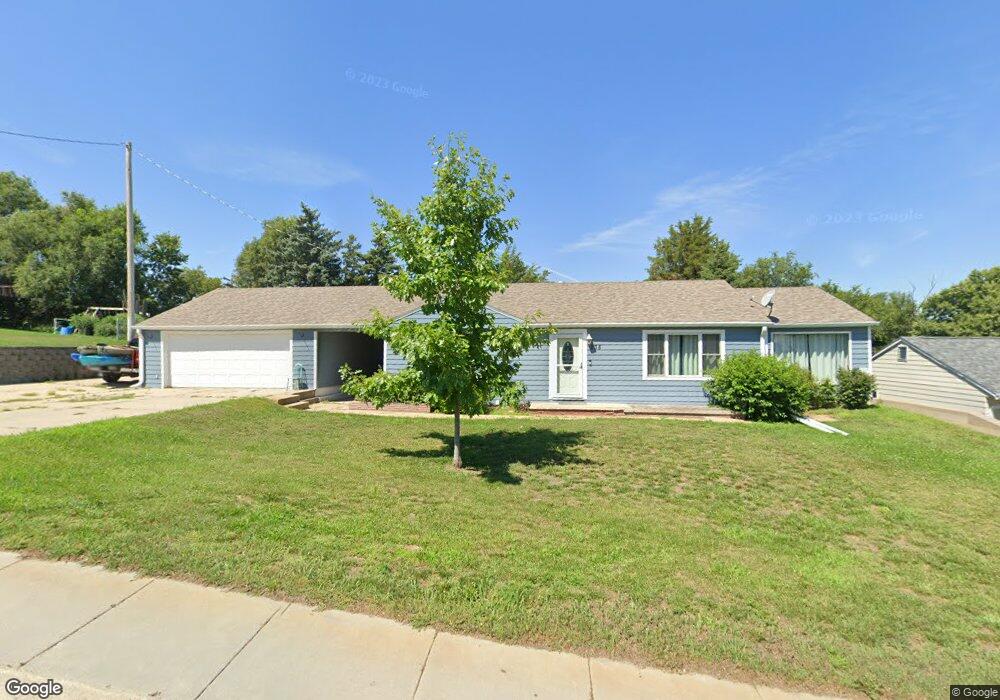
835 S 11th Ave Broken Bow, NE 68822
Estimated Value: $154,000 - $249,000
Studio
2
Baths
1,408
Sq Ft
$151/Sq Ft
Est. Value
About This Home
This home is located at 835 S 11th Ave, Broken Bow, NE 68822 and is currently estimated at $212,569, approximately $150 per square foot. 835 S 11th Ave is a home located in Custer County with nearby schools including North Park Elementary School, Broken Bow Junior High School, and Broken Bow High School.
Ownership History
Date
Name
Owned For
Owner Type
Purchase Details
Closed on
May 3, 2016
Sold by
Synak Jeffrey J and Synak Camille A
Bought by
Spanel Logan G
Current Estimated Value
Purchase Details
Closed on
Sep 9, 2011
Sold by
Honeywell Viron L and Honeywell Marie B
Bought by
Synak Jeffrey J and Synak Camille A
Purchase Details
Closed on
Apr 6, 2006
Sold by
Birnie Elmer
Bought by
Honeywell Viron L and Honeywell Marie B
Create a Home Valuation Report for This Property
The Home Valuation Report is an in-depth analysis detailing your home's value as well as a comparison with similar homes in the area
Home Values in the Area
Average Home Value in this Area
Purchase History
| Date | Buyer | Sale Price | Title Company |
|---|---|---|---|
| Spanel Logan G | $160,000 | -- | |
| Synak Jeffrey J | $61,500 | -- | |
| Honeywell Viron L | $89,900 | -- |
Source: Public Records
Tax History
| Year | Tax Paid | Tax Assessment Tax Assessment Total Assessment is a certain percentage of the fair market value that is determined by local assessors to be the total taxable value of land and additions on the property. | Land | Improvement |
|---|---|---|---|---|
| 2025 | $3,025 | $236,823 | $18,368 | $218,455 |
| 2024 | $2,847 | $207,767 | $18,368 | $189,399 |
| 2023 | $2,930 | $187,055 | $18,368 | $168,687 |
| 2022 | $3,167 | $172,583 | $18,368 | $154,215 |
| 2021 | $3,075 | $171,435 | $17,220 | $154,215 |
| 2020 | $2,966 | $166,790 | $17,220 | $149,570 |
| 2019 | $2,706 | $152,436 | $8,610 | $143,826 |
| 2017 | $1,871 | $102,458 | $8,610 | $93,848 |
| 2016 | $1,725 | $86,324 | $5,281 | $81,043 |
| 2015 | $1,510 | $74,913 | $5,176 | $69,737 |
| 2014 | $1,510 | $68,102 | $4,705 | $63,397 |
Source: Public Records
Map
Nearby Homes
Your Personal Tour Guide
Ask me questions while you tour the home.