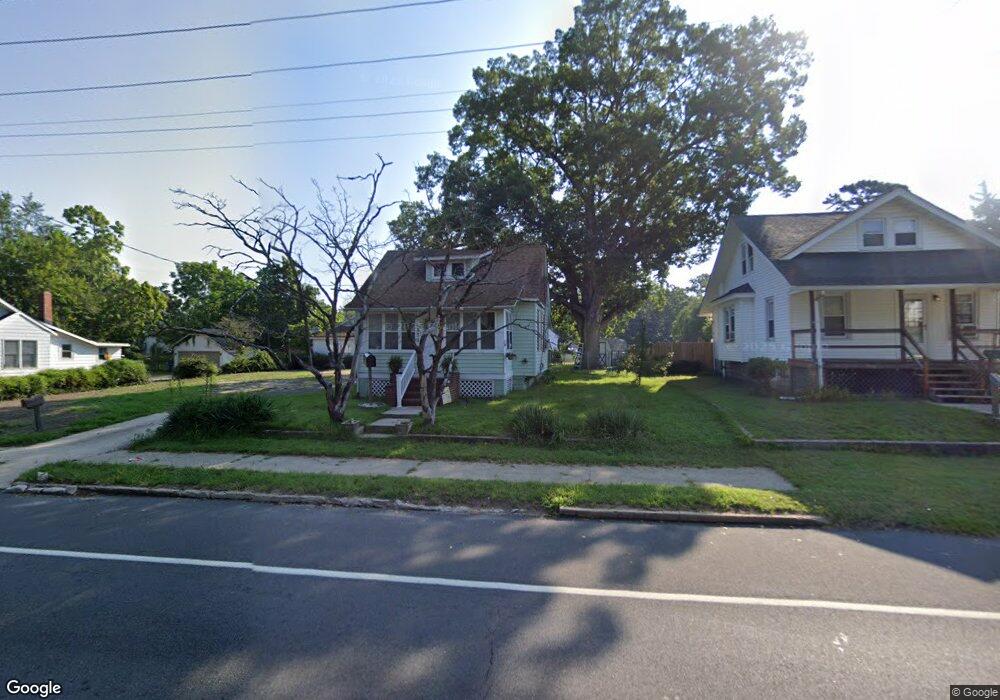
835 S 2nd St Millville, NJ 08332
Estimated Value: $195,000 - $235,000
2
Beds
1
Bath
802
Sq Ft
$269/Sq Ft
Est. Value
About This Home
This home is located at 835 S 2nd St, Millville, NJ 08332 and is currently estimated at $215,357, approximately $268 per square foot. 835 S 2nd St is a home located in Cumberland County with nearby schools including R.M. Bacon Elementary School, Lakeside Middle School, and Memorial High School.
Ownership History
Date
Name
Owned For
Owner Type
Purchase Details
Closed on
Oct 5, 2018
Sold by
Morris Helen and Pierce Tiffany
Bought by
Risley Bridgett
Current Estimated Value
Home Financials for this Owner
Home Financials are based on the most recent Mortgage that was taken out on this home.
Original Mortgage
$112,891
Outstanding Balance
$100,446
Interest Rate
5.5%
Mortgage Type
FHA
Estimated Equity
$114,911
Purchase Details
Closed on
Feb 20, 2007
Sold by
Carroll Patricia E
Bought by
Morris Helen and Morris Pierce
Create a Home Valuation Report for This Property
The Home Valuation Report is an in-depth analysis detailing your home's value as well as a comparison with similar homes in the area
Home Values in the Area
Average Home Value in this Area
Purchase History
| Date | Buyer | Sale Price | Title Company |
|---|---|---|---|
| Risley Bridgett | $115,000 | -- | |
| Risley Bridgett L | $115,000 | -- | |
| Morris Helen | $90,000 | -- |
Source: Public Records
Mortgage History
| Date | Status | Borrower | Loan Amount |
|---|---|---|---|
| Open | Risley Bridgett L | $112,891 |
Source: Public Records
Tax History Compared to Growth
Tax History
| Year | Tax Paid | Tax Assessment Tax Assessment Total Assessment is a certain percentage of the fair market value that is determined by local assessors to be the total taxable value of land and additions on the property. | Land | Improvement |
|---|---|---|---|---|
| 2025 | $3,266 | $83,200 | $29,800 | $53,400 |
| 2024 | $3,266 | $83,200 | $29,800 | $53,400 |
| 2023 | $3,238 | $83,200 | $29,800 | $53,400 |
| 2022 | $3,154 | $83,200 | $29,800 | $53,400 |
| 2021 | $3,052 | $83,200 | $29,800 | $53,400 |
| 2020 | $3,001 | $83,200 | $29,800 | $53,400 |
| 2019 | $2,862 | $83,200 | $29,800 | $53,400 |
| 2018 | $2,803 | $83,200 | $29,800 | $53,400 |
| 2017 | $2,777 | $83,200 | $29,800 | $53,400 |
| 2016 | $2,742 | $83,200 | $29,800 | $53,400 |
| 2015 | $2,681 | $83,200 | $29,800 | $53,400 |
| 2014 | $2,686 | $83,200 | $29,800 | $53,400 |
Source: Public Records
Map
Nearby Homes