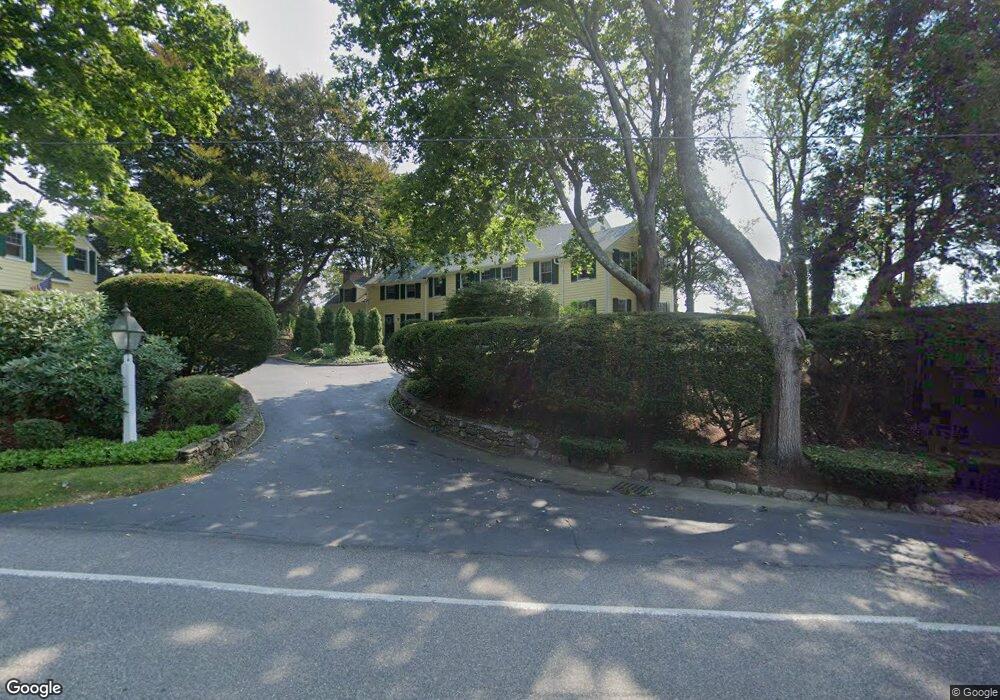
835 S Main St Centerville, MA 02632
Centerville NeighborhoodEstimated Value: $3,703,000 - $6,151,000
5
Beds
5
Baths
3,201
Sq Ft
$1,441/Sq Ft
Est. Value
About This Home
This home is located at 835 S Main St, Centerville, MA 02632 and is currently estimated at $4,611,466, approximately $1,440 per square foot. 835 S Main St is a home located in Barnstable County with nearby schools including Centerville Elementary School, Barnstable United Elementary School, and Barnstable Intermediate School.
Ownership History
Date
Name
Owned For
Owner Type
Purchase Details
Closed on
Mar 22, 1993
Sold by
Boston Safe Deposit Tr
Bought by
Rust Louise D
Current Estimated Value
Home Financials for this Owner
Home Financials are based on the most recent Mortgage that was taken out on this home.
Original Mortgage
$392,000
Interest Rate
7.75%
Mortgage Type
Purchase Money Mortgage
Purchase Details
Closed on
Jun 16, 1992
Sold by
Hills Jean F
Bought by
Boston Safe Deposit
Create a Home Valuation Report for This Property
The Home Valuation Report is an in-depth analysis detailing your home's value as well as a comparison with similar homes in the area
Home Values in the Area
Average Home Value in this Area
Purchase History
| Date | Buyer | Sale Price | Title Company |
|---|---|---|---|
| Rust Louise D | $560,000 | -- | |
| Rust Louise D | $560,000 | -- | |
| Boston Safe Deposit | $740,000 | -- |
Source: Public Records
Mortgage History
| Date | Status | Borrower | Loan Amount |
|---|---|---|---|
| Closed | Rust Louise D | $392,000 |
Source: Public Records
Tax History
| Year | Tax Paid | Tax Assessment Tax Assessment Total Assessment is a certain percentage of the fair market value that is determined by local assessors to be the total taxable value of land and additions on the property. | Land | Improvement |
|---|---|---|---|---|
| 2025 | $36,279 | $4,484,400 | $3,397,200 | $1,087,200 |
| 2024 | $34,604 | $4,430,700 | $3,397,200 | $1,033,500 |
| 2023 | $33,282 | $3,990,700 | $3,088,400 | $902,300 |
| 2022 | $29,480 | $3,058,100 | $2,287,700 | $770,400 |
| 2021 | $30,231 | $2,881,900 | $2,170,400 | $711,500 |
| 2020 | $32,695 | $2,983,100 | $2,346,400 | $636,700 |
| 2019 | $33,772 | $2,994,000 | $2,346,400 | $647,600 |
| 2018 | $34,298 | $3,056,900 | $2,469,800 | $587,100 |
| 2017 | $32,642 | $3,033,600 | $2,469,800 | $563,800 |
| 2016 | $32,377 | $2,970,400 | $2,435,000 | $535,400 |
| 2015 | $32,699 | $3,013,700 | $2,447,800 | $565,900 |
Source: Public Records
Map
Nearby Homes
- 818 S Main St
- 12 S Cedar Rd
- 89 Swift Ave
- 1060 Craigville Beach Rd
- 117 Parsley Ln
- 351 Swift Ave
- 498 Elliott Rd
- 77 Robbins St
- 16 2nd Ave Unit 4
- 103 Pine Tree Dr
- 52 Meadow Farm Rd
- 53 Meadow Farm Rd
- 156 S Main St
- 443 Elliott Rd
- 780 Craigville Beach Rd Unit D-2
- 780 Craigville Beach Rd Unit 1
- 780 Craigville Beach Rd
- 200 Lumbert Mill Rd
- 51 Larch Ln
- 29 Oak Ridge Rd
Your Personal Tour Guide
Ask me questions while you tour the home.