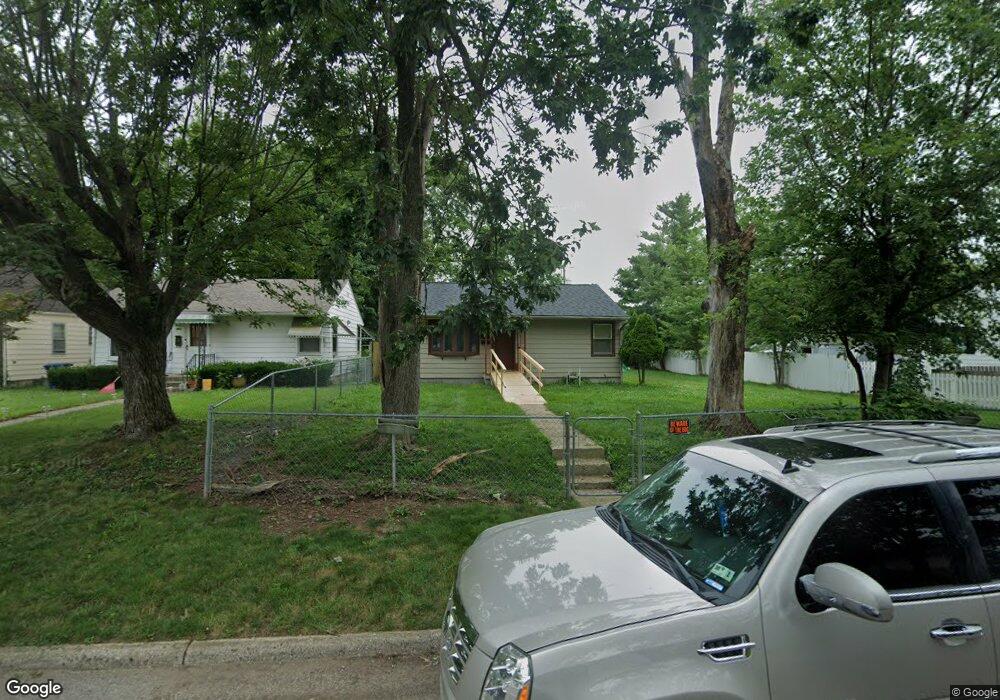
835 S Weyant Ave Columbus, OH 43227
Eastmoor NeighborhoodEstimated Value: $147,000 - $169,771
2
Beds
1
Bath
750
Sq Ft
$213/Sq Ft
Est. Value
About This Home
This home is located at 835 S Weyant Ave, Columbus, OH 43227 and is currently estimated at $159,443, approximately $212 per square foot. 835 S Weyant Ave is a home located in Franklin County with nearby schools including Fairmoor Elementary School, Johnson Park Middle School, and Walnut Ridge High School.
Ownership History
Date
Name
Owned For
Owner Type
Purchase Details
Closed on
Jul 27, 2011
Sold by
Secretary Of Housing & Urban Development
Bought by
Buitron Saul and Mercado Camacho Alicia
Current Estimated Value
Purchase Details
Closed on
Mar 9, 2011
Sold by
Thornton Raphael and Case #10 Cv04 006438
Bought by
Flagstar Bank Fsb
Purchase Details
Closed on
Mar 8, 2011
Sold by
Flagstar Bank Fsb
Bought by
Secretary Of Housing & Urban Development
Purchase Details
Closed on
Jul 30, 2004
Sold by
Day Closures Llc
Bought by
Thornton Raphael
Home Financials for this Owner
Home Financials are based on the most recent Mortgage that was taken out on this home.
Original Mortgage
$74,411
Interest Rate
6.1%
Mortgage Type
FHA
Purchase Details
Closed on
Apr 6, 2004
Sold by
Day Debra L and Day William R
Bought by
Day Closures Llc
Purchase Details
Closed on
Dec 15, 2003
Sold by
Winn Shirley A and Harnett Thelma F
Bought by
Day Debra L
Create a Home Valuation Report for This Property
The Home Valuation Report is an in-depth analysis detailing your home's value as well as a comparison with similar homes in the area
Home Values in the Area
Average Home Value in this Area
Purchase History
| Date | Buyer | Sale Price | Title Company |
|---|---|---|---|
| Buitron Saul | $18,300 | Lakeside Ti | |
| Flagstar Bank Fsb | $42,000 | Attorney | |
| Secretary Of Housing & Urban Development | -- | Attorney | |
| Thornton Raphael | $75,000 | -- | |
| Day Closures Llc | -- | -- | |
| Day Debra L | $46,300 | Foundation Title Agency Inc |
Source: Public Records
Mortgage History
| Date | Status | Borrower | Loan Amount |
|---|---|---|---|
| Previous Owner | Thornton Raphael | $74,411 |
Source: Public Records
Tax History Compared to Growth
Tax History
| Year | Tax Paid | Tax Assessment Tax Assessment Total Assessment is a certain percentage of the fair market value that is determined by local assessors to be the total taxable value of land and additions on the property. | Land | Improvement |
|---|---|---|---|---|
| 2024 | $2,199 | $49,000 | $15,120 | $33,880 |
| 2023 | $2,171 | $49,000 | $15,120 | $33,880 |
| 2022 | $1,318 | $25,410 | $9,170 | $16,240 |
| 2021 | $1,320 | $25,410 | $9,170 | $16,240 |
| 2020 | $1,322 | $25,410 | $9,170 | $16,240 |
| 2019 | $1,248 | $20,580 | $7,630 | $12,950 |
| 2018 | $1,193 | $20,580 | $7,630 | $12,950 |
| 2017 | $1,252 | $20,580 | $7,630 | $12,950 |
| 2016 | $1,257 | $18,970 | $5,250 | $13,720 |
| 2015 | $1,141 | $18,970 | $5,250 | $13,720 |
| 2014 | $1,144 | $18,970 | $5,250 | $13,720 |
| 2013 | $627 | $21,070 | $5,845 | $15,225 |
Source: Public Records
Map
Nearby Homes
- 836 S Weyant Ave
- 864 S Waverly St
- 891 S Weyant Ave Unit 893
- 842 S Hampton Rd
- 892 Ruby Ave
- 711 S Waverly St
- 733 S Napoleon Ave
- 708 S Waverly St
- 804 S Ashburton Rd
- 646 S Weyant Ave
- 647 S Napoleon Ave
- 635 Elizabeth Ave
- 3339 Towers Ct N
- 3314 Towers Ct S
- 622 S Ashburton Rd
- 3353 Towers Ct S
- 1054 S Hampton Rd
- 3325 Towers Ct S
- 3012 Hampshire Rd
- 1048 S James Rd
- 839 S Weyant Ave
- 821 S Weyant Ave
- 845 S Weyant Ave
- 817 S Weyant Ave
- 849 S Weyant Ave
- 828 S Waverly St
- 813 S Weyant Ave
- 816 S Waverly St
- 855 S Weyant Ave
- 840 S Waverly St
- 812 S Waverly St
- 807 S Weyant Ave
- 842 S Weyant Ave
- 824 S Weyant Ave Unit 26
- 844 S Waverly St
- 848 S Weyant Ave
- 859 S Weyant Ave
- 806 S Waverly St
- 852 S Weyant Ave Unit 854
- 850 S Waverly St