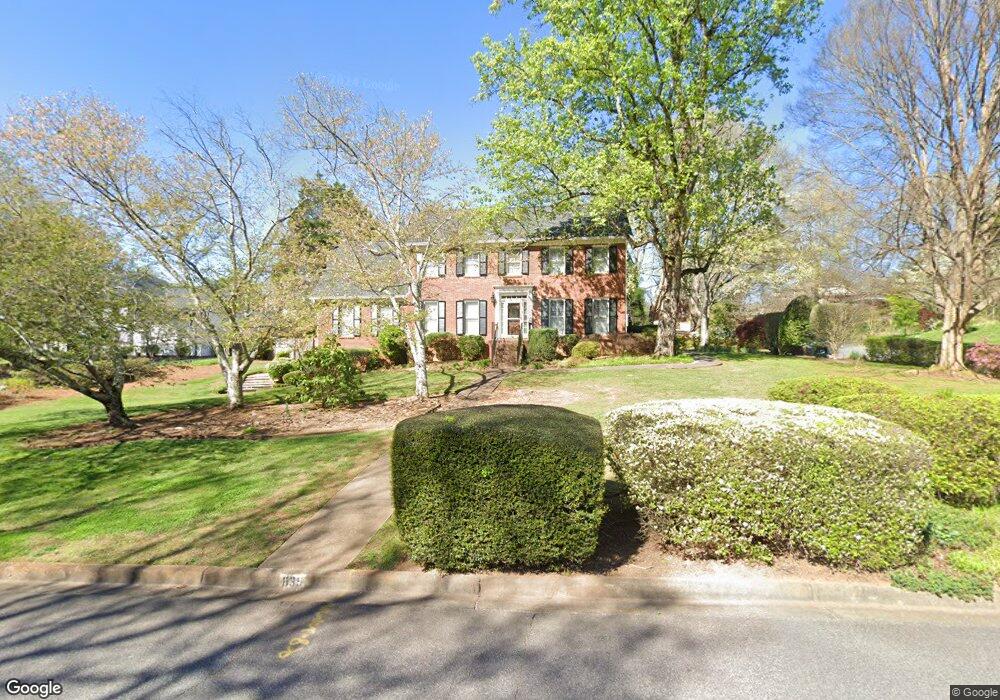
835 Saddle Ridge Trace Unit 9 Roswell, GA 30076
Saddle Creek NeighborhoodEstimated Value: $687,000 - $873,000
4
Beds
3
Baths
2,706
Sq Ft
$282/Sq Ft
Est. Value
About This Home
This home is located at 835 Saddle Ridge Trace Unit 9, Roswell, GA 30076 and is currently estimated at $762,814, approximately $281 per square foot. 835 Saddle Ridge Trace Unit 9 is a home located in Fulton County with nearby schools including Sweet Apple Elementary School, Elkins Pointe Middle School, and Milton High School.
Ownership History
Date
Name
Owned For
Owner Type
Purchase Details
Closed on
Dec 30, 2002
Sold by
Woodman Charlotte M
Bought by
Mckillop James P and Mckillop Louise
Current Estimated Value
Home Financials for this Owner
Home Financials are based on the most recent Mortgage that was taken out on this home.
Original Mortgage
$274,400
Outstanding Balance
$126,891
Interest Rate
6.1%
Mortgage Type
New Conventional
Estimated Equity
$635,923
Purchase Details
Closed on
Jul 26, 2001
Sold by
Woodman Charlotte
Bought by
Woodman Andrew J and Woodman Charlotte M
Home Financials for this Owner
Home Financials are based on the most recent Mortgage that was taken out on this home.
Original Mortgage
$200,000
Interest Rate
7.09%
Mortgage Type
New Conventional
Purchase Details
Closed on
May 27, 1999
Sold by
Woodman Andrew J and Woodman Charlotte
Bought by
Woodman Charlotte
Create a Home Valuation Report for This Property
The Home Valuation Report is an in-depth analysis detailing your home's value as well as a comparison with similar homes in the area
Home Values in the Area
Average Home Value in this Area
Purchase History
| Date | Buyer | Sale Price | Title Company |
|---|---|---|---|
| Mckillop James P | $343,000 | -- | |
| Woodman Andrew J | -- | -- | |
| Woodman Charlotte | -- | -- |
Source: Public Records
Mortgage History
| Date | Status | Borrower | Loan Amount |
|---|---|---|---|
| Open | Mckillop James P | $274,400 | |
| Previous Owner | Woodman Andrew J | $200,000 |
Source: Public Records
Tax History Compared to Growth
Tax History
| Year | Tax Paid | Tax Assessment Tax Assessment Total Assessment is a certain percentage of the fair market value that is determined by local assessors to be the total taxable value of land and additions on the property. | Land | Improvement |
|---|---|---|---|---|
| 2025 | $908 | $209,720 | $62,640 | $147,080 |
| 2023 | $6,274 | $222,280 | $62,360 | $159,920 |
| 2022 | $3,785 | $203,600 | $42,680 | $160,920 |
| 2021 | $4,497 | $202,480 | $29,360 | $173,120 |
| 2020 | $4,567 | $200,080 | $29,000 | $171,080 |
| 2019 | $734 | $163,080 | $31,120 | $131,960 |
| 2018 | $3,958 | $159,240 | $30,400 | $128,840 |
| 2017 | $3,732 | $141,320 | $19,720 | $121,600 |
| 2016 | $3,712 | $141,320 | $19,720 | $121,600 |
| 2015 | $4,497 | $141,320 | $19,720 | $121,600 |
| 2014 | $3,542 | $128,280 | $17,880 | $110,400 |
Source: Public Records
Map
Nearby Homes
- 300 Saddle Creek Ln
- 775 Upper Hembree Rd
- 200 Welford Trace
- 565 Camber Woods Dr
- 1110 Arya Dr
- 11925 Stradford Wood
- 755 Anna Ln
- 530 Camber Woods Dr
- 1010 Blue Indigo Dr
- 1115 Primrose Dr
- 12250 Broadwell Rd
- 1040 Jordan Ln
- 230 Bluff Oak Dr
- 165 Foe Creek Ct
- 1270 Taylor Oaks Dr
- 600 Rounsaville Rd
- 290 Rucker Rd
- 160 Watermill Falls
- 5065 Jonquilla Dr
- 640 Mae Ln
- 845 Saddle Ridge Trace
- 895 Saddle Ridge Ct Unit 9
- 825 Saddle Ridge Trace
- 880 Saddle Ridge Trace
- 870 Saddle Ridge Trace
- 0 Saddle Ridge Ct
- 855 Saddle Ridge Trace
- 880 Saddle Ridge Trace
- 900 Saddle Ridge Ct Unit 9
- 905 Saddle Ridge Ct
- 905 Saddle Ridge Ct
- 860 Saddle Ridge Trace Unit 38
- 860 Saddle Ridge Trace Unit 9
- 860 Saddle Ridge Trace
- 305 Saddle Creek Dr Unit 9
- 815 Saddle Ridge Trace Unit 9
- 890 Saddle Ridge Trace
- 910 Saddle Ridge Ct Unit 9
- 850 Saddle Ridge Trace
- 315 Saddle Creek Dr Unit 9