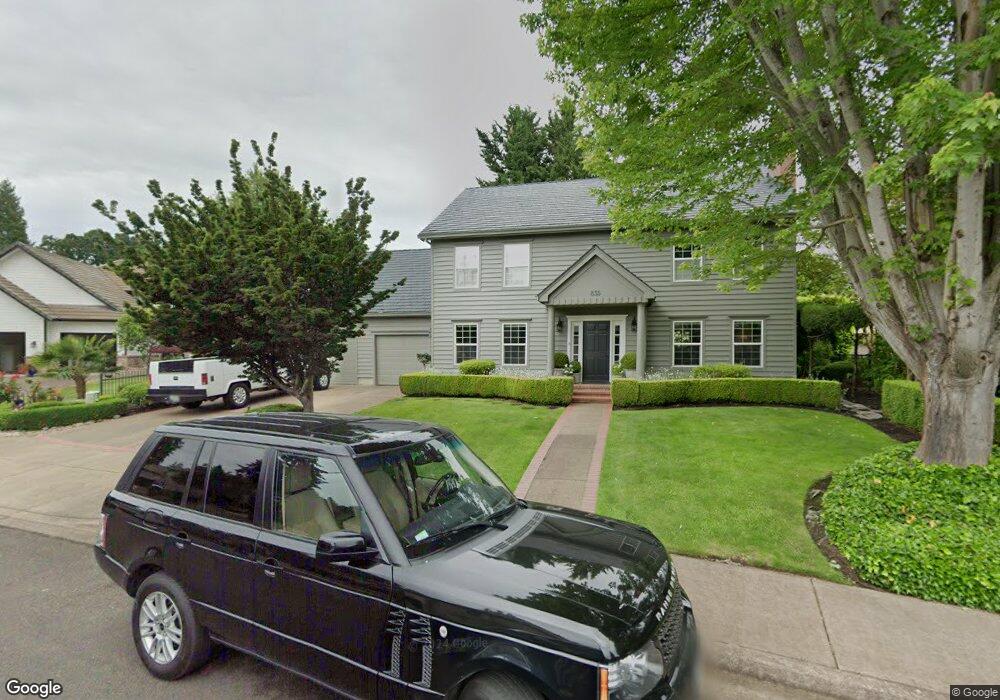
835 Sand Ave Eugene, OR 97401
Cal Young NeighborhoodEstimated Value: $675,000 - $862,000
3
Beds
3
Baths
2,660
Sq Ft
$294/Sq Ft
Est. Value
About This Home
This home is located at 835 Sand Ave, Eugene, OR 97401 and is currently estimated at $781,618, approximately $293 per square foot. 835 Sand Ave is a home located in Lane County with nearby schools including Willagillespie Elementary School, Cal Young Middle School, and Sheldon High School.
Ownership History
Date
Name
Owned For
Owner Type
Purchase Details
Closed on
May 3, 2021
Sold by
Graham Steen
Bought by
Graham Bruce J and Graham Alisa D
Current Estimated Value
Home Financials for this Owner
Home Financials are based on the most recent Mortgage that was taken out on this home.
Original Mortgage
$452,000
Outstanding Balance
$342,204
Interest Rate
3.1%
Mortgage Type
New Conventional
Estimated Equity
$439,415
Purchase Details
Closed on
Sep 1, 2011
Sold by
Graham Alisa D
Bought by
Graham Steen
Home Financials for this Owner
Home Financials are based on the most recent Mortgage that was taken out on this home.
Original Mortgage
$359,200
Interest Rate
4.46%
Mortgage Type
New Conventional
Purchase Details
Closed on
Mar 24, 2003
Sold by
Graham Bruce James
Bought by
Graham Alisa D
Create a Home Valuation Report for This Property
The Home Valuation Report is an in-depth analysis detailing your home's value as well as a comparison with similar homes in the area
Home Values in the Area
Average Home Value in this Area
Purchase History
| Date | Buyer | Sale Price | Title Company |
|---|---|---|---|
| Graham Bruce J | $565,000 | Evergreen Land Title Company | |
| Graham Steen | $449,000 | First American Title | |
| Graham Alisa D | -- | Western Pioneer Title Co |
Source: Public Records
Mortgage History
| Date | Status | Borrower | Loan Amount |
|---|---|---|---|
| Open | Graham Bruce J | $452,000 | |
| Previous Owner | Graham Steen | $359,200 |
Source: Public Records
Tax History
| Year | Tax Paid | Tax Assessment Tax Assessment Total Assessment is a certain percentage of the fair market value that is determined by local assessors to be the total taxable value of land and additions on the property. | Land | Improvement |
|---|---|---|---|---|
| 2025 | $9,684 | $497,026 | -- | -- |
| 2024 | $9,563 | $482,550 | -- | -- |
| 2023 | $9,563 | $468,496 | -- | -- |
| 2022 | $8,959 | $454,851 | $0 | $0 |
| 2021 | $8,415 | $441,603 | $0 | $0 |
| 2020 | $8,382 | $428,741 | $0 | $0 |
| 2019 | $8,105 | $416,254 | $0 | $0 |
| 2018 | $7,617 | $392,360 | $0 | $0 |
| 2017 | $7,197 | $392,360 | $0 | $0 |
| 2016 | $6,805 | $380,932 | $0 | $0 |
| 2015 | $6,639 | $369,837 | $0 | $0 |
| 2014 | $6,494 | $359,065 | $0 | $0 |
Source: Public Records
Map
Nearby Homes
- 875 Sand Ave
- 1230 Evening Star Ln
- 1282 Evening Star Ln
- 516 Spyglass Dr
- 0 Crenshaw Rd Unit 740506614
- 0 Butte Ln
- 1230 Debrick Rd
- 410 Spyglass Dr
- 982 Shaughnessy Ln
- 1376 Brickley Rd
- 2015 Eastwood Ln
- 2036 Eastwood Ln
- 2150 Greenview St
- 2084 Eastwood Ln
- 1328 Spyglass Dr
- 143 Shelton McMurphey Blvd
- 133 Shelton McMurphey Blvd
- 9 N Monroe St Unit B
- 9 N Monroe St Unit D
- 9 N Monroe St Unit A
Your Personal Tour Guide
Ask me questions while you tour the home.